Admin Dashboard
INFO
By default endpoint to access Admin Dashboard is:
/adminfor the Admin Dashboard
An example: If your web server is running on localhost:8090, you can access the Admin Dashboard at the following URL: http://localhost:8090/admin - if using comby defaults.
The Admin Dashboard (AD) is included in comby by default, but can be disabled if needed. Since the dashboard is updated regularly, the following images may no longer be current. The images come from a local development instance and contain very few entries.
Accounts View
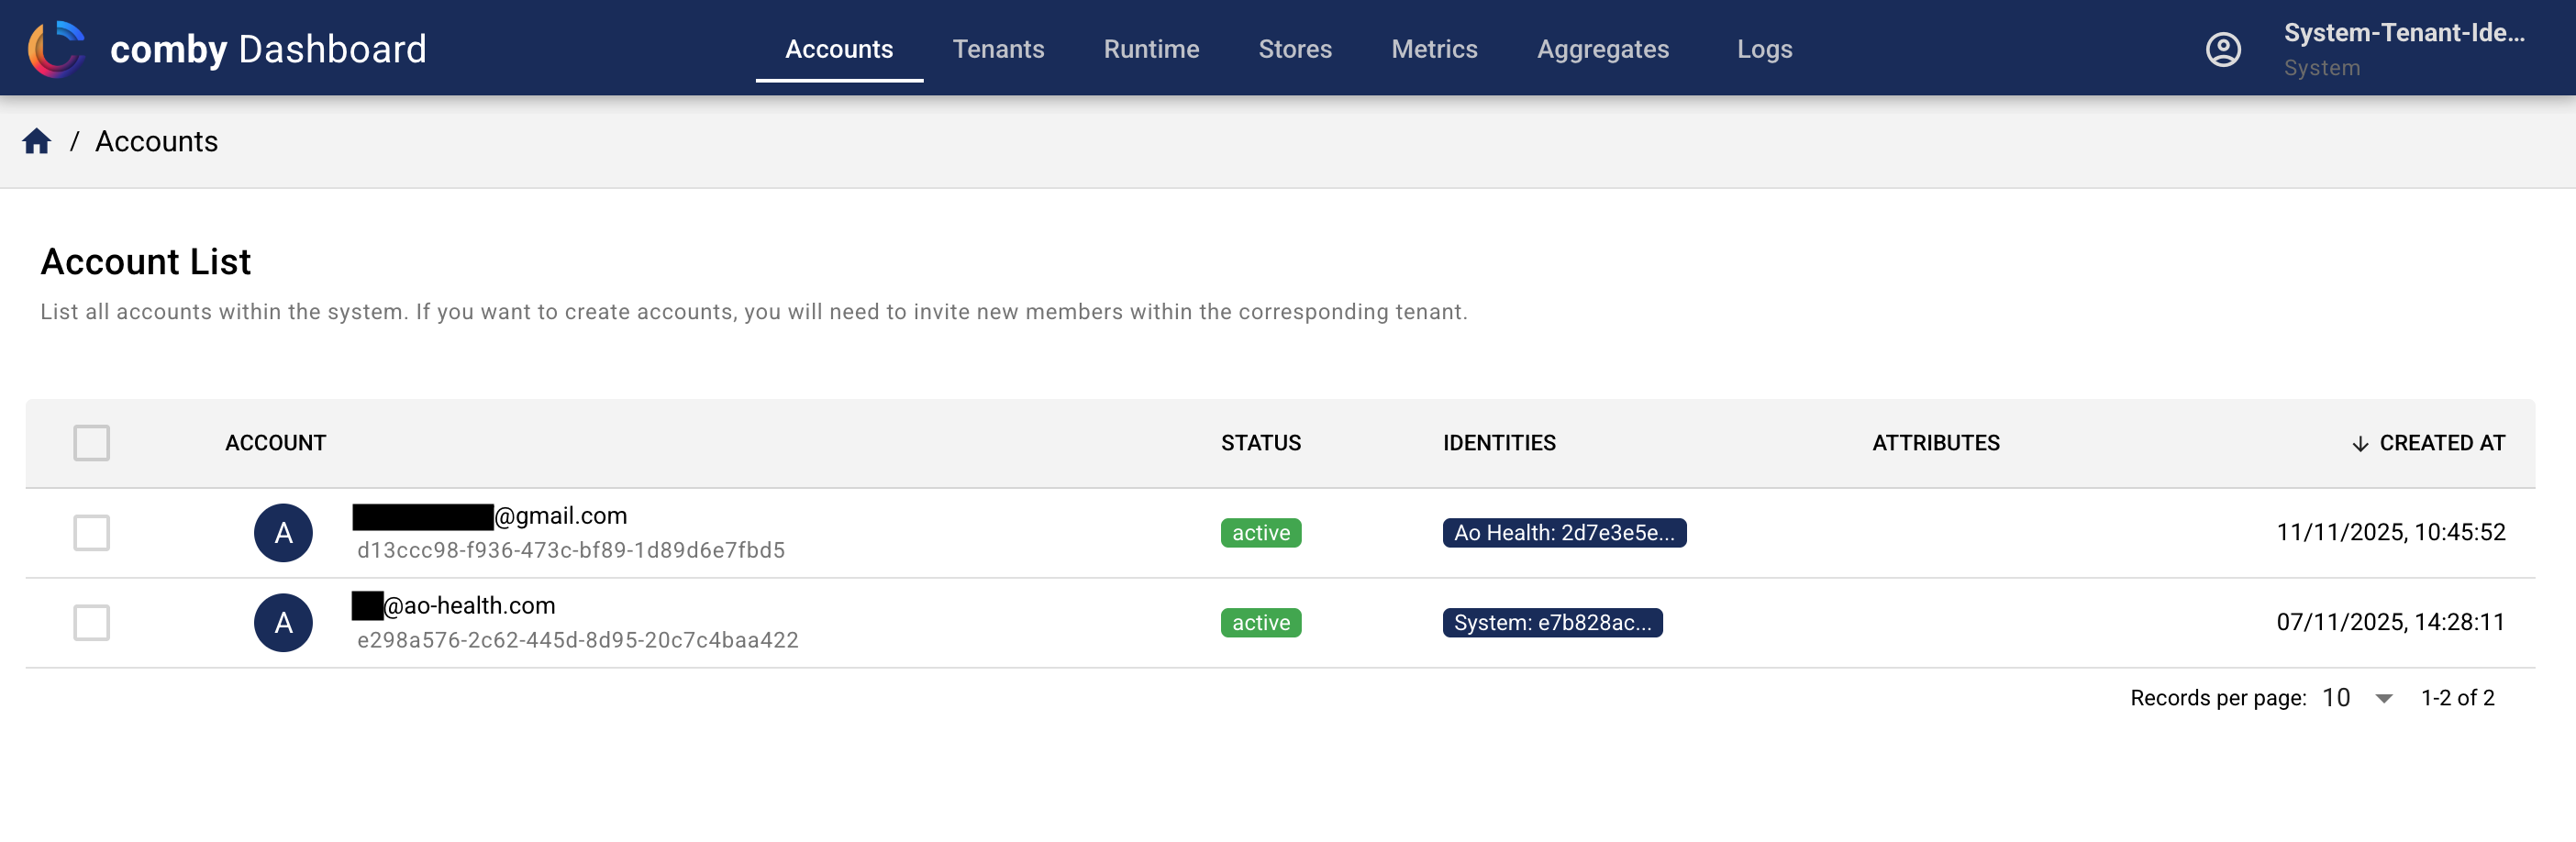
Accounts are managed separately and independently of tenants. That's the design: One account can have multiple identities across multiple tenants.
Tenants View
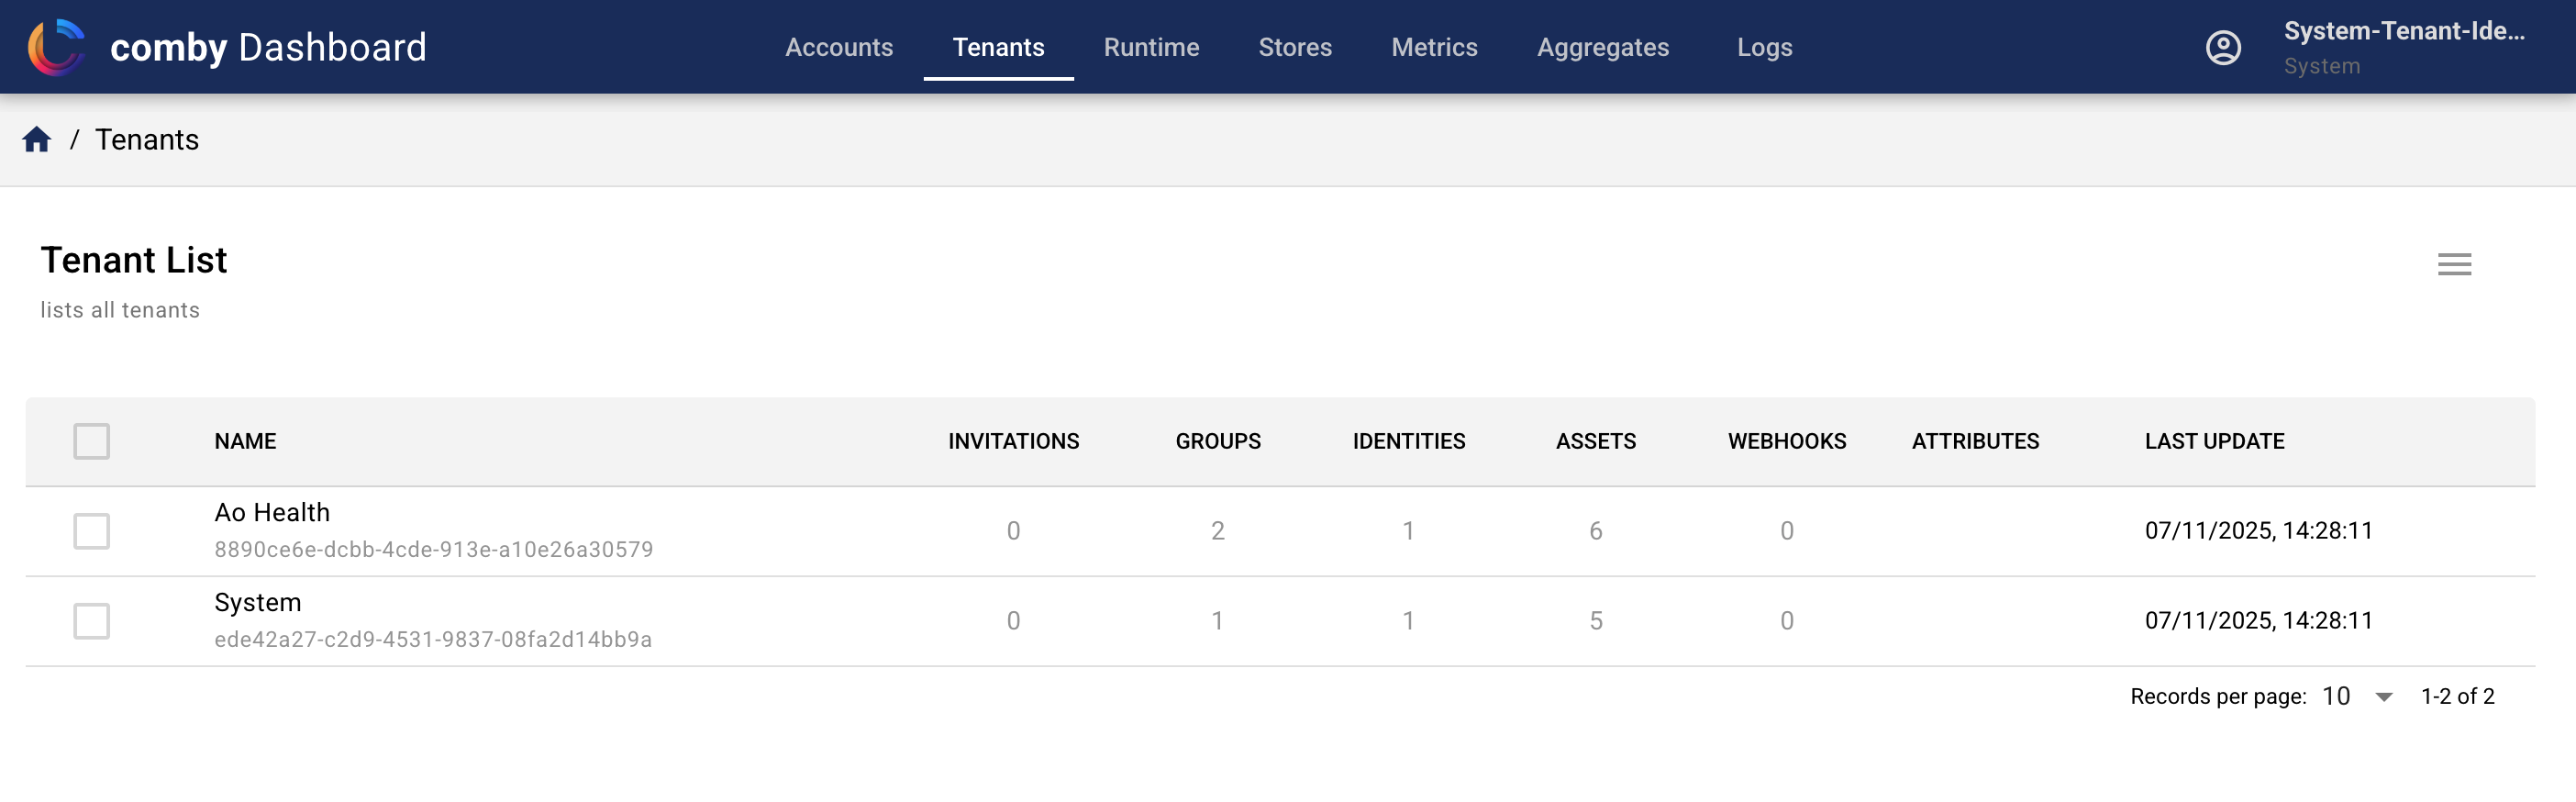
Tenants are the primary organizational units in comby. Each tenant can have its own set of users, groups, and permissions, allowing for flexible multi-tenancy support.
Groups View
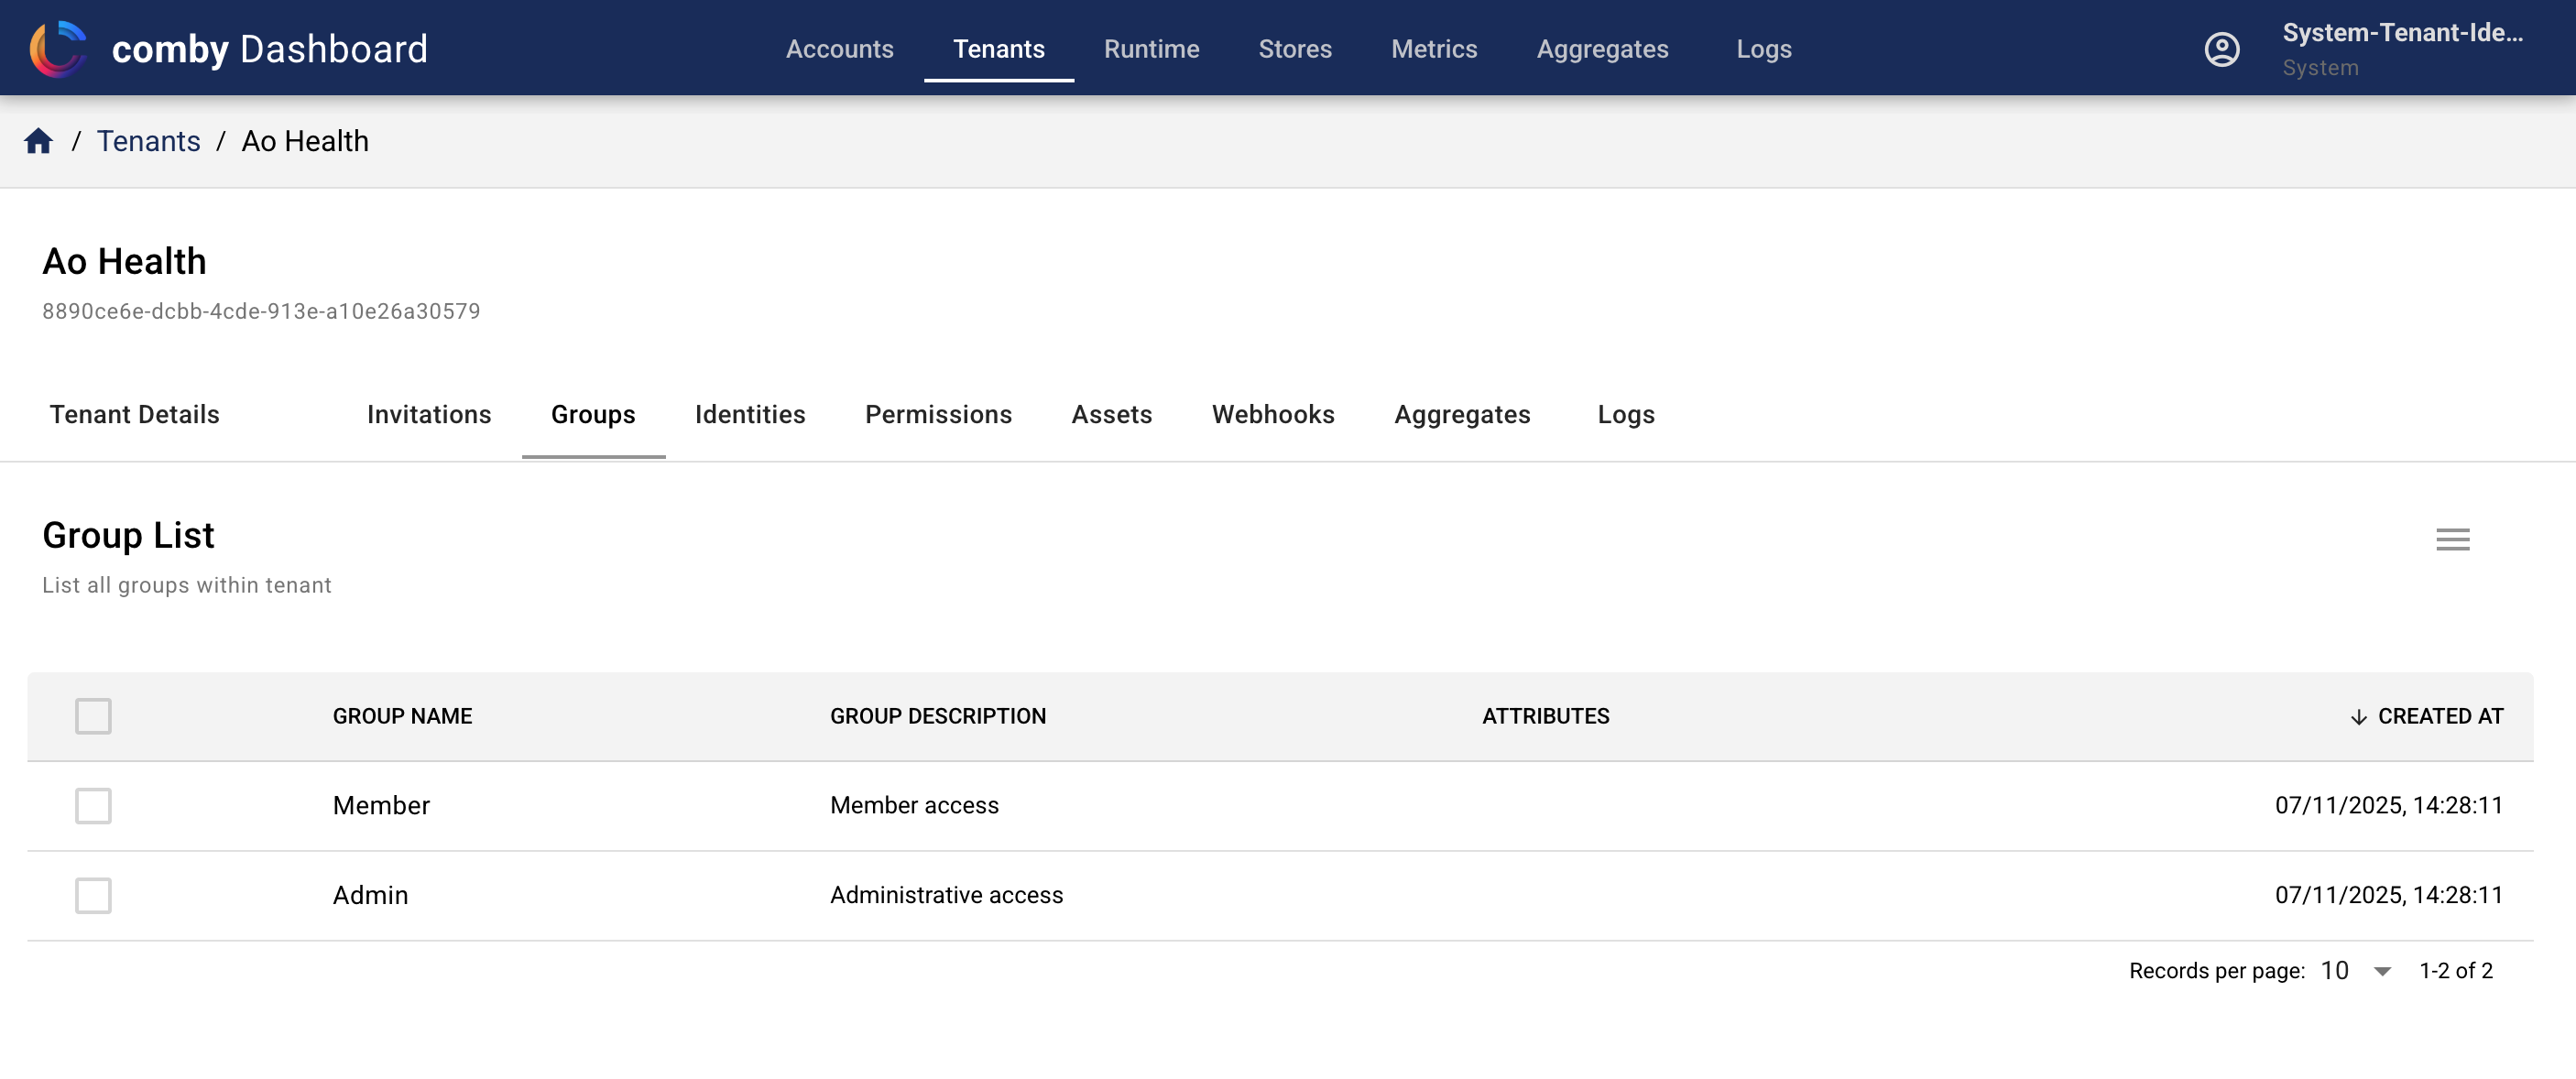
Groups are used to manage permissions and access control within each tenant. By organizing users into groups, you can easily assign and manage permissions at a higher level, streamlining the administration process.
Identities View
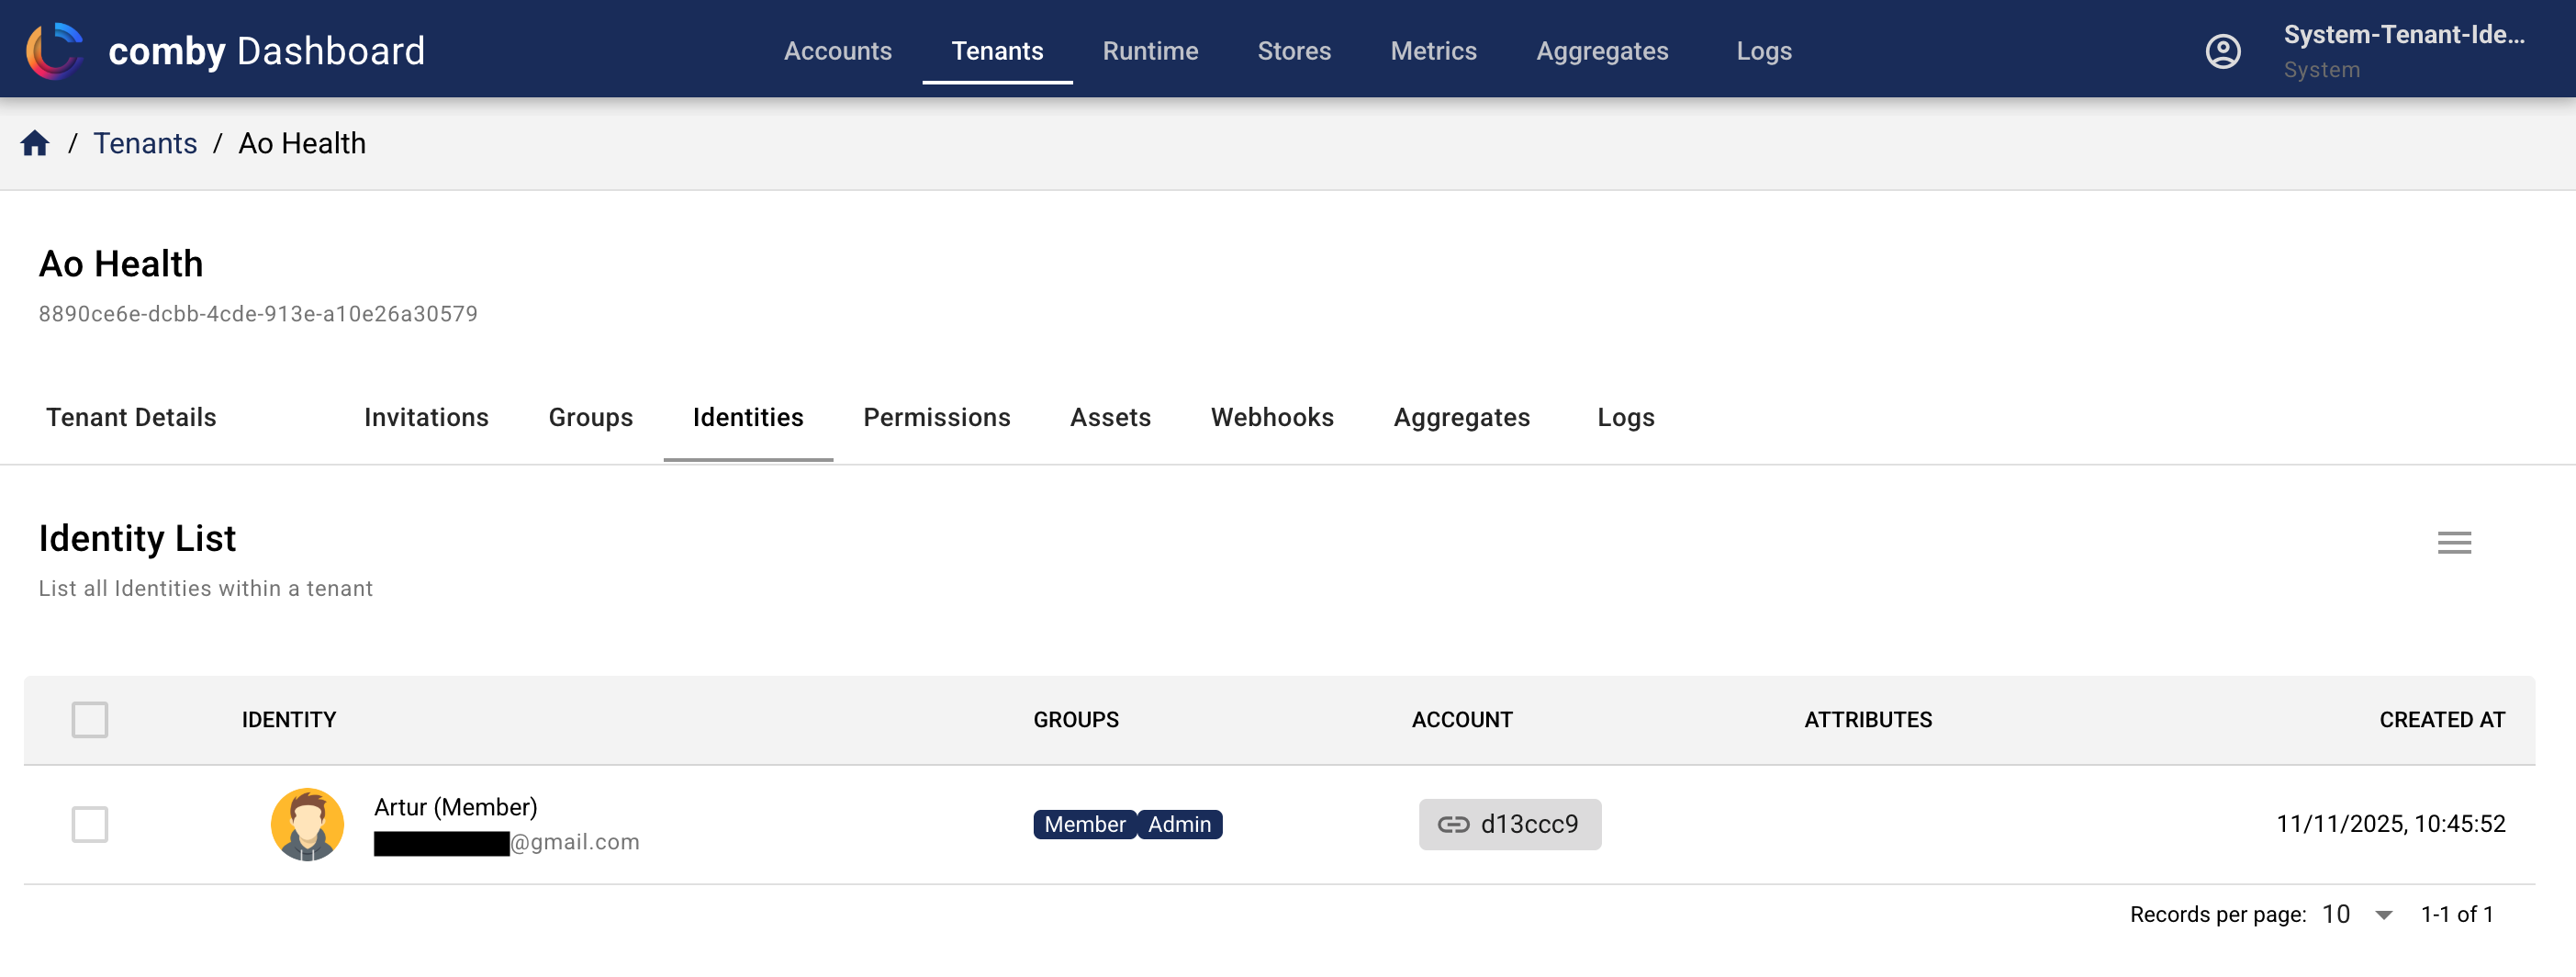
Identities represent the individual users within each tenant. Each identity can have its own set of attributes and groups (i.e., permissions), allowing for fine-grained access control and customization.
Workspaces View
Workspaces provide fine-grained isolation within a tenant. The workspace detail view includes multiple tabs for managing different aspects:
Groups Tab
Manage workspace-specific groups with their own permission sets. These groups are independent from tenant-level groups.
Identity Members Tab
Manage individual identities that have direct access to this workspace. Each identity member can be assigned to one or more workspace groups.
Workspace Members Tab
Manage workspaces that are members of this workspace (transitive membership). When a workspace is added as a member:
- All identities in the member workspace automatically gain access to this workspace
- The member workspace is assigned to specific groups, determining what permissions the transitive members receive
- This enables team-based access management without adding individual identities
Example: Adding "Engineering Team" workspace as a member with "Developers" group means all engineers automatically get "Developers" permissions in this workspace.
Permissions Tab
View and manage the permission matrix for this workspace, showing which groups have access to which operations.
Permissions View
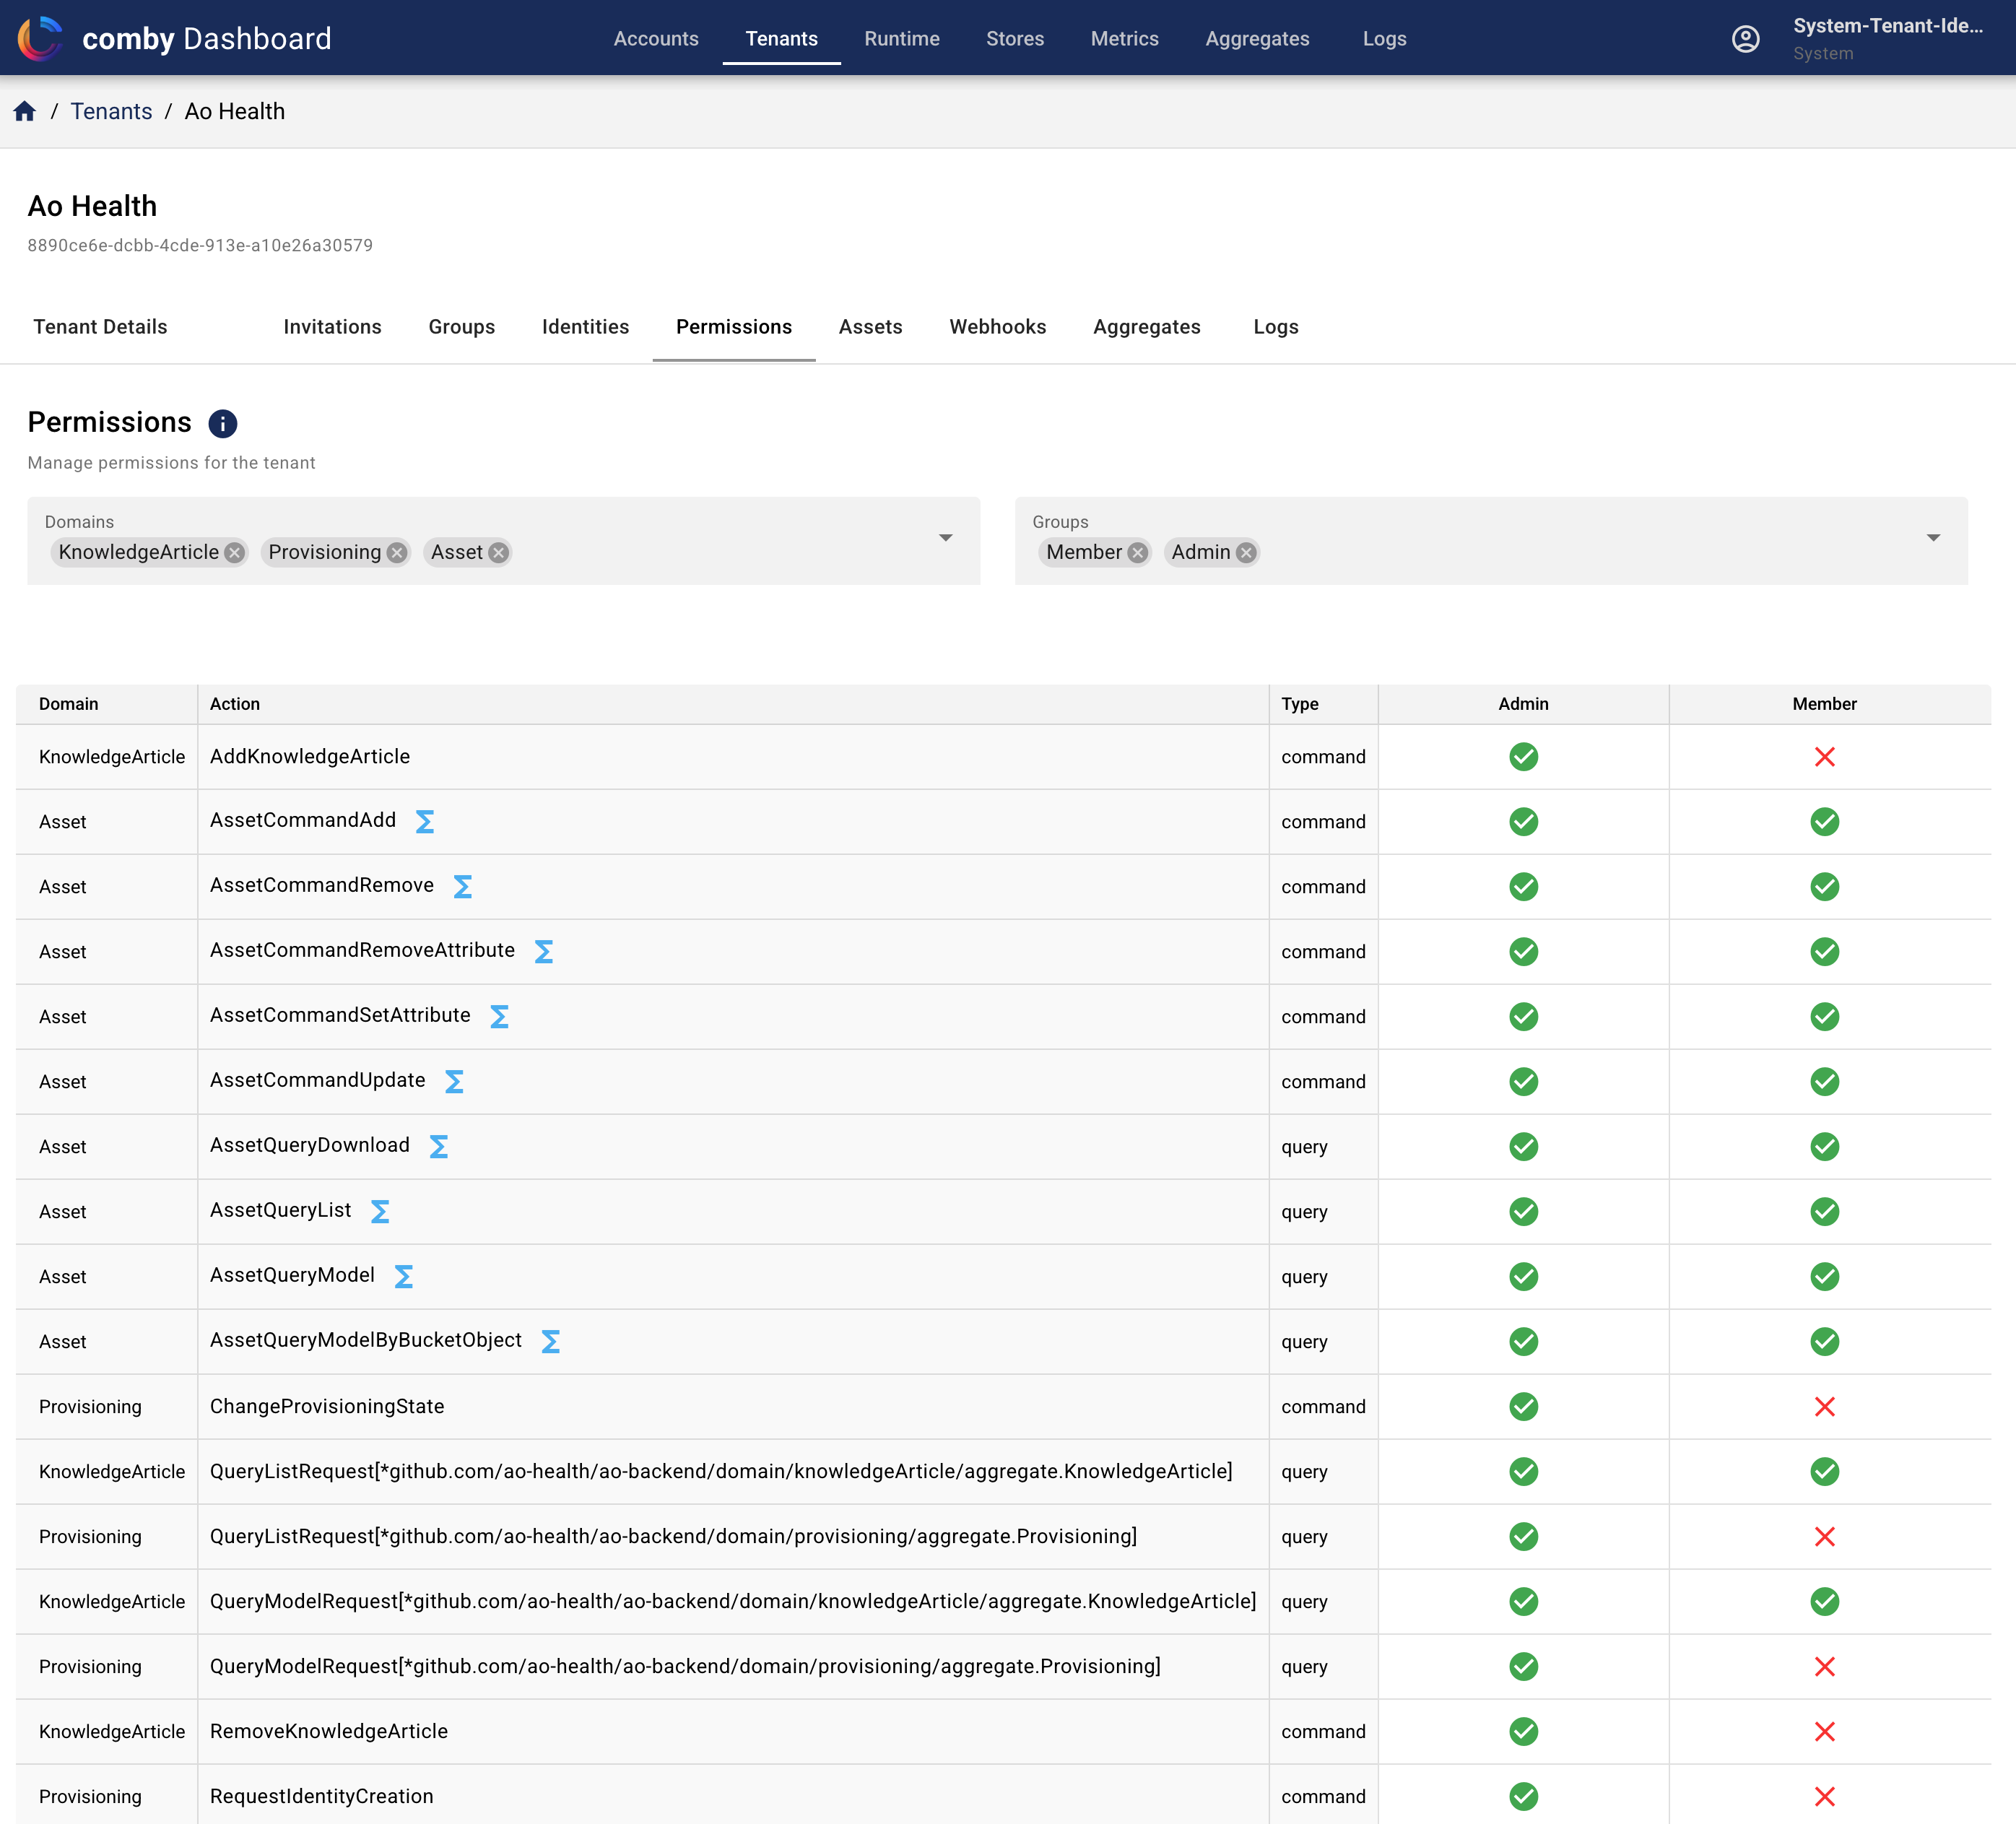
Permissions are the rules that define what actions groups can perform within each tenant. By managing permissions effectively, you can ensure that groups have the appropriate level of access to resources and functionality.
Assets View
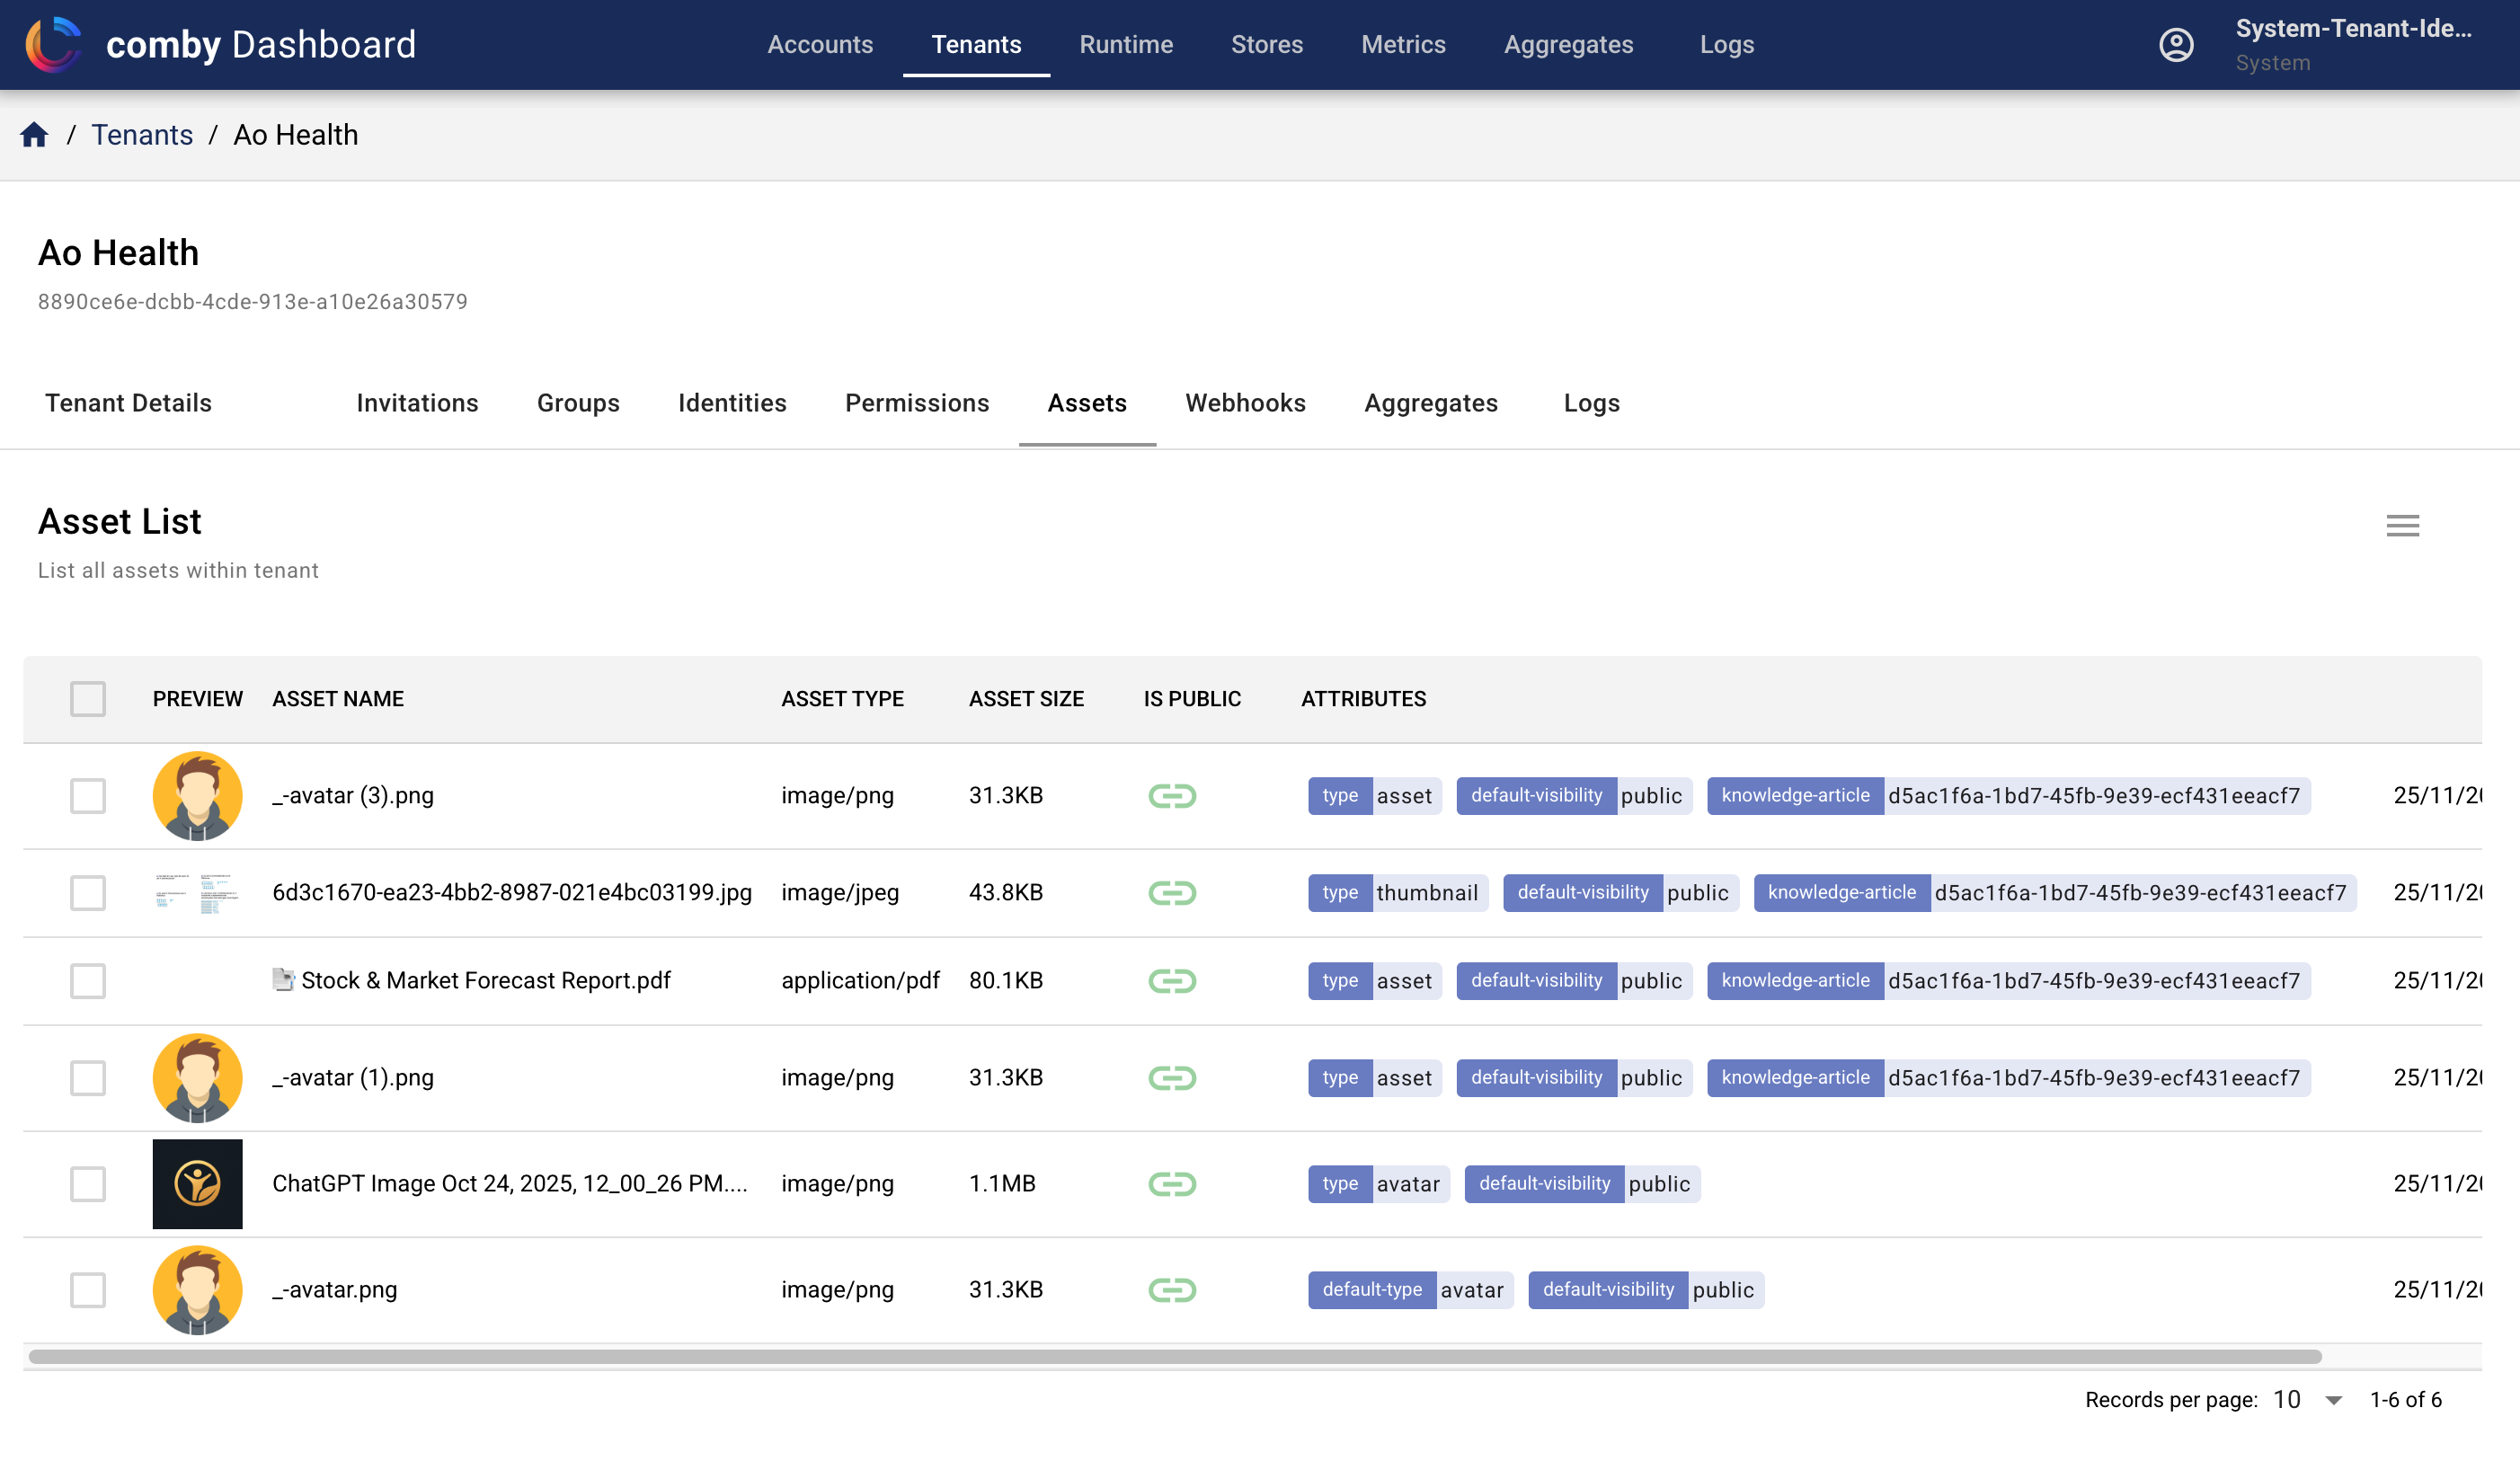
Assets are files or resources associated with tenants or identities. The Admin Dashboard provides a way to manage these assets, including uploading, organizing, and deleting them as needed.
Aggregates View
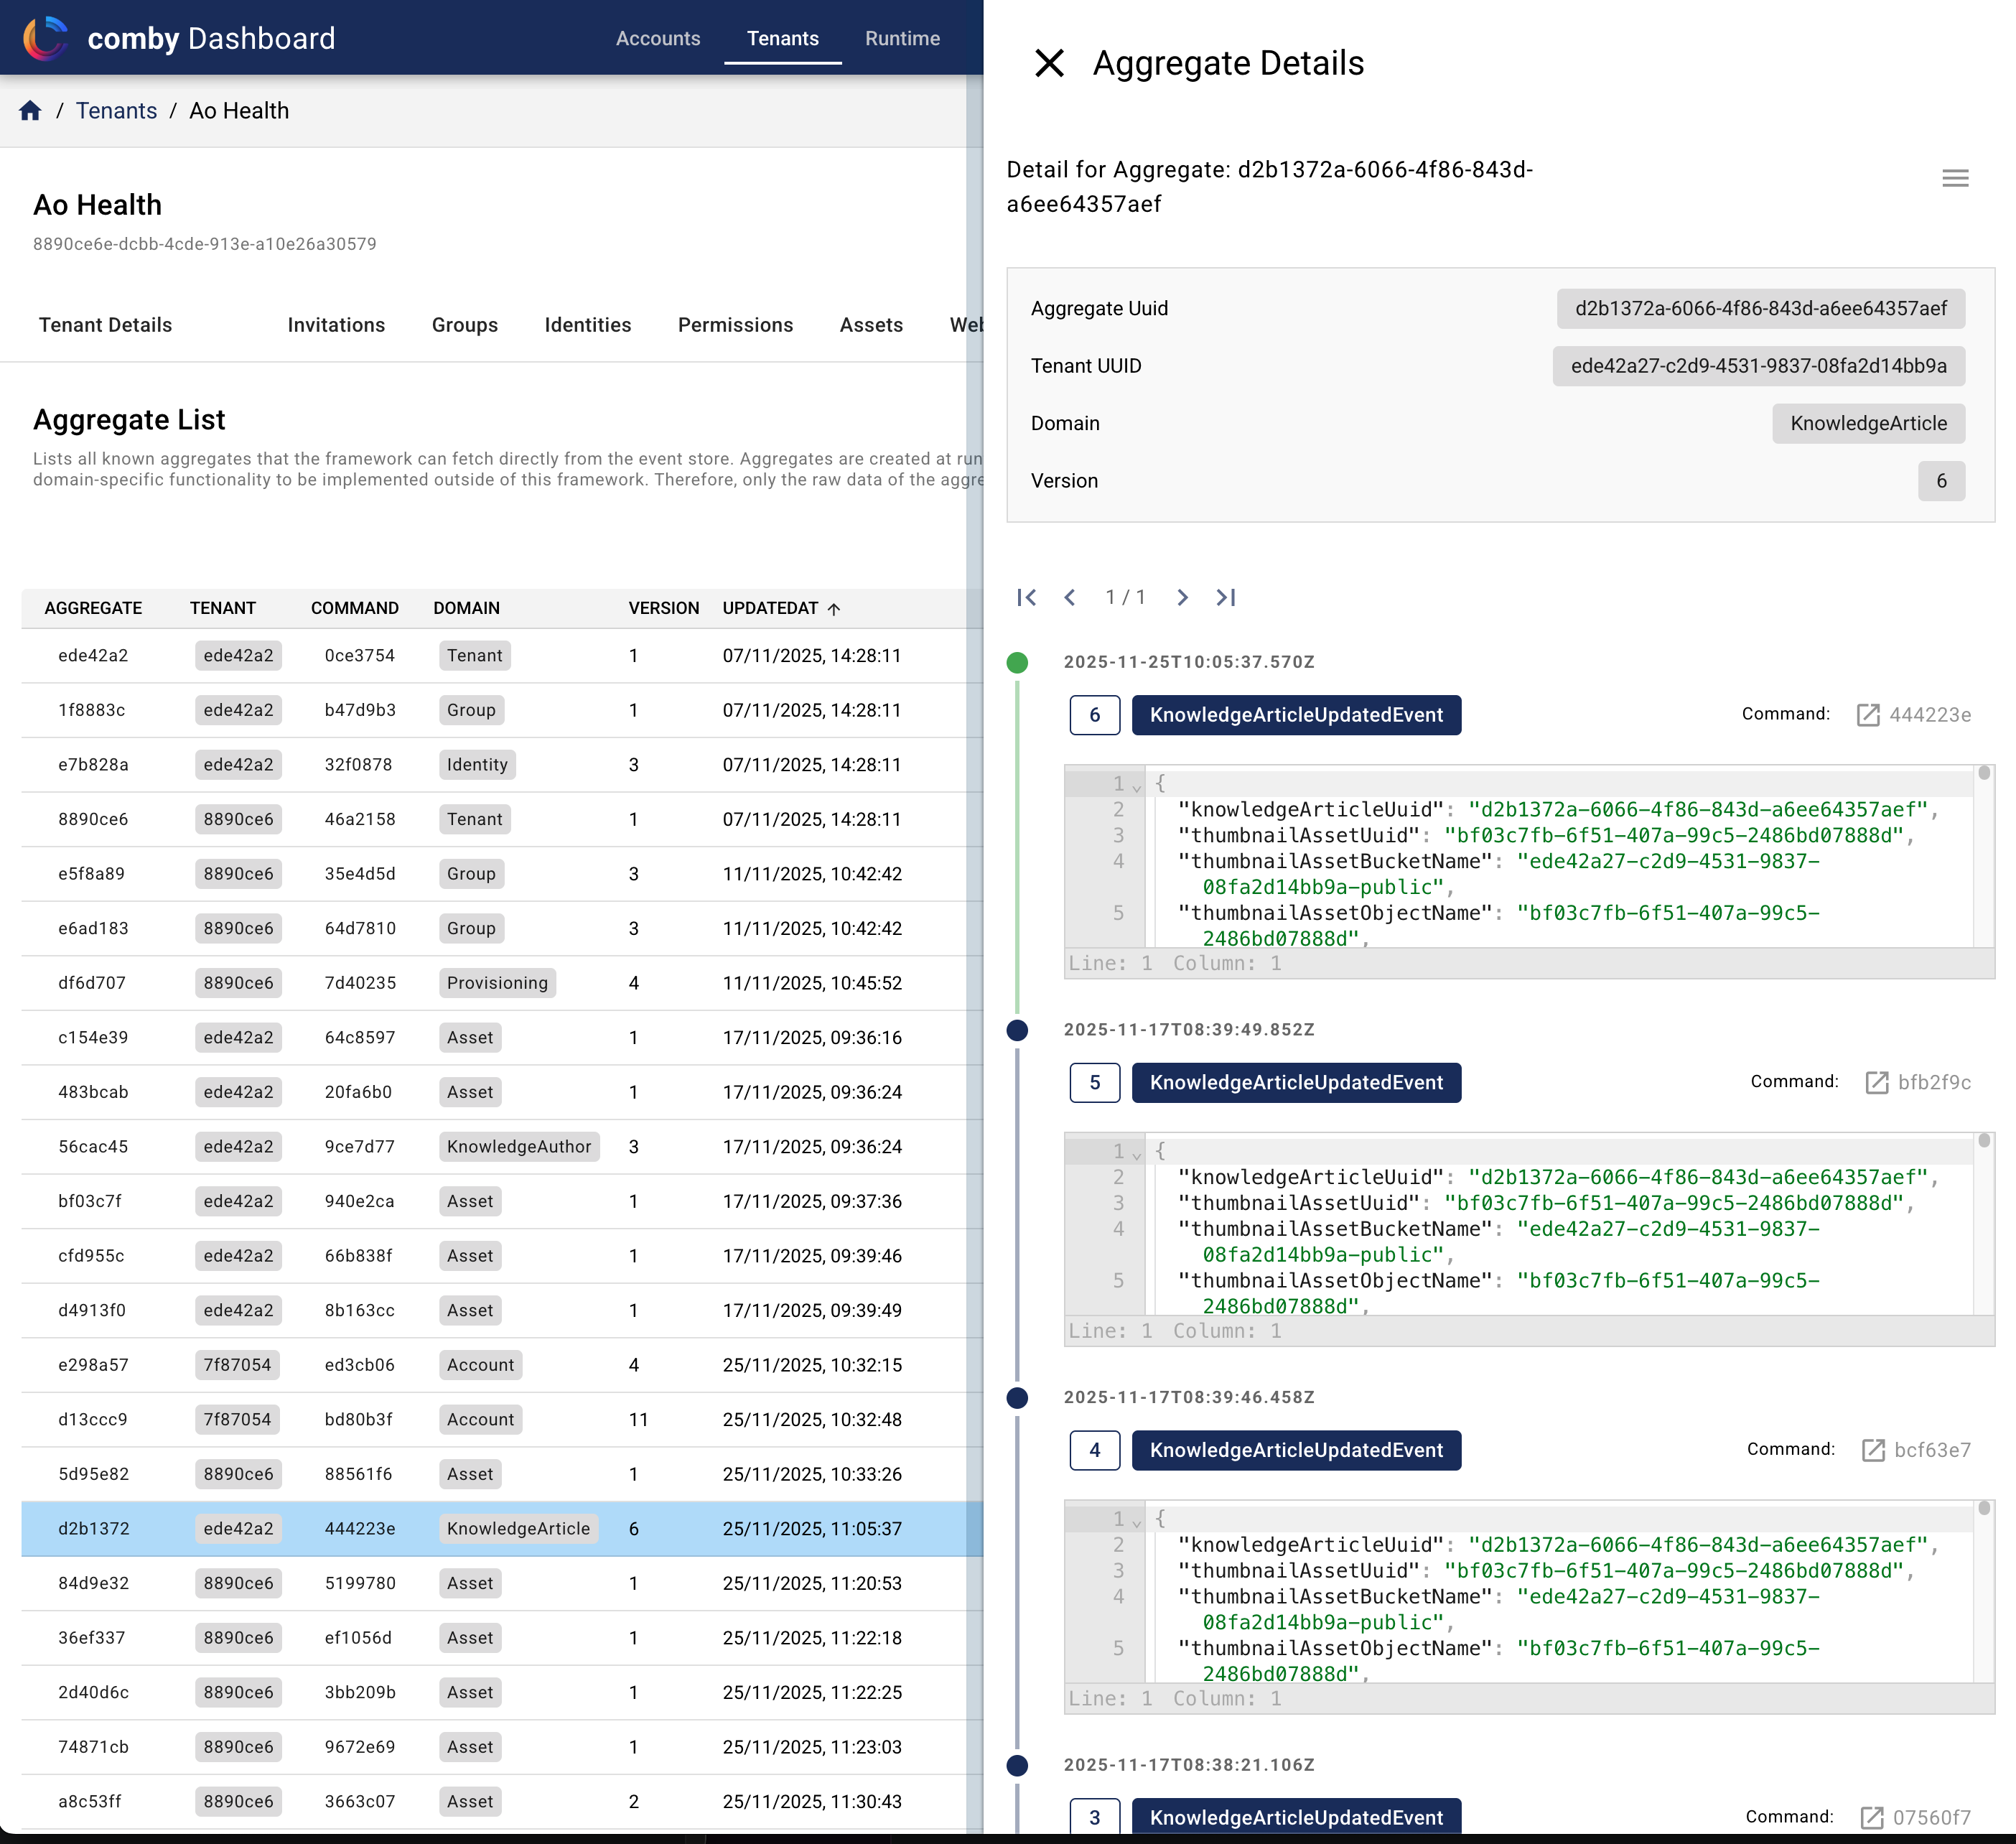
Aggregates are the central building blocks of the domain model. They represent a collection of domain objects that are treated as a single unit. Aggregates are responsible for enforcing business rules and maintaining the consistency of the domain model. They encapsulate the state of the domain objects and provide methods for interacting with them.
Event-Handler View
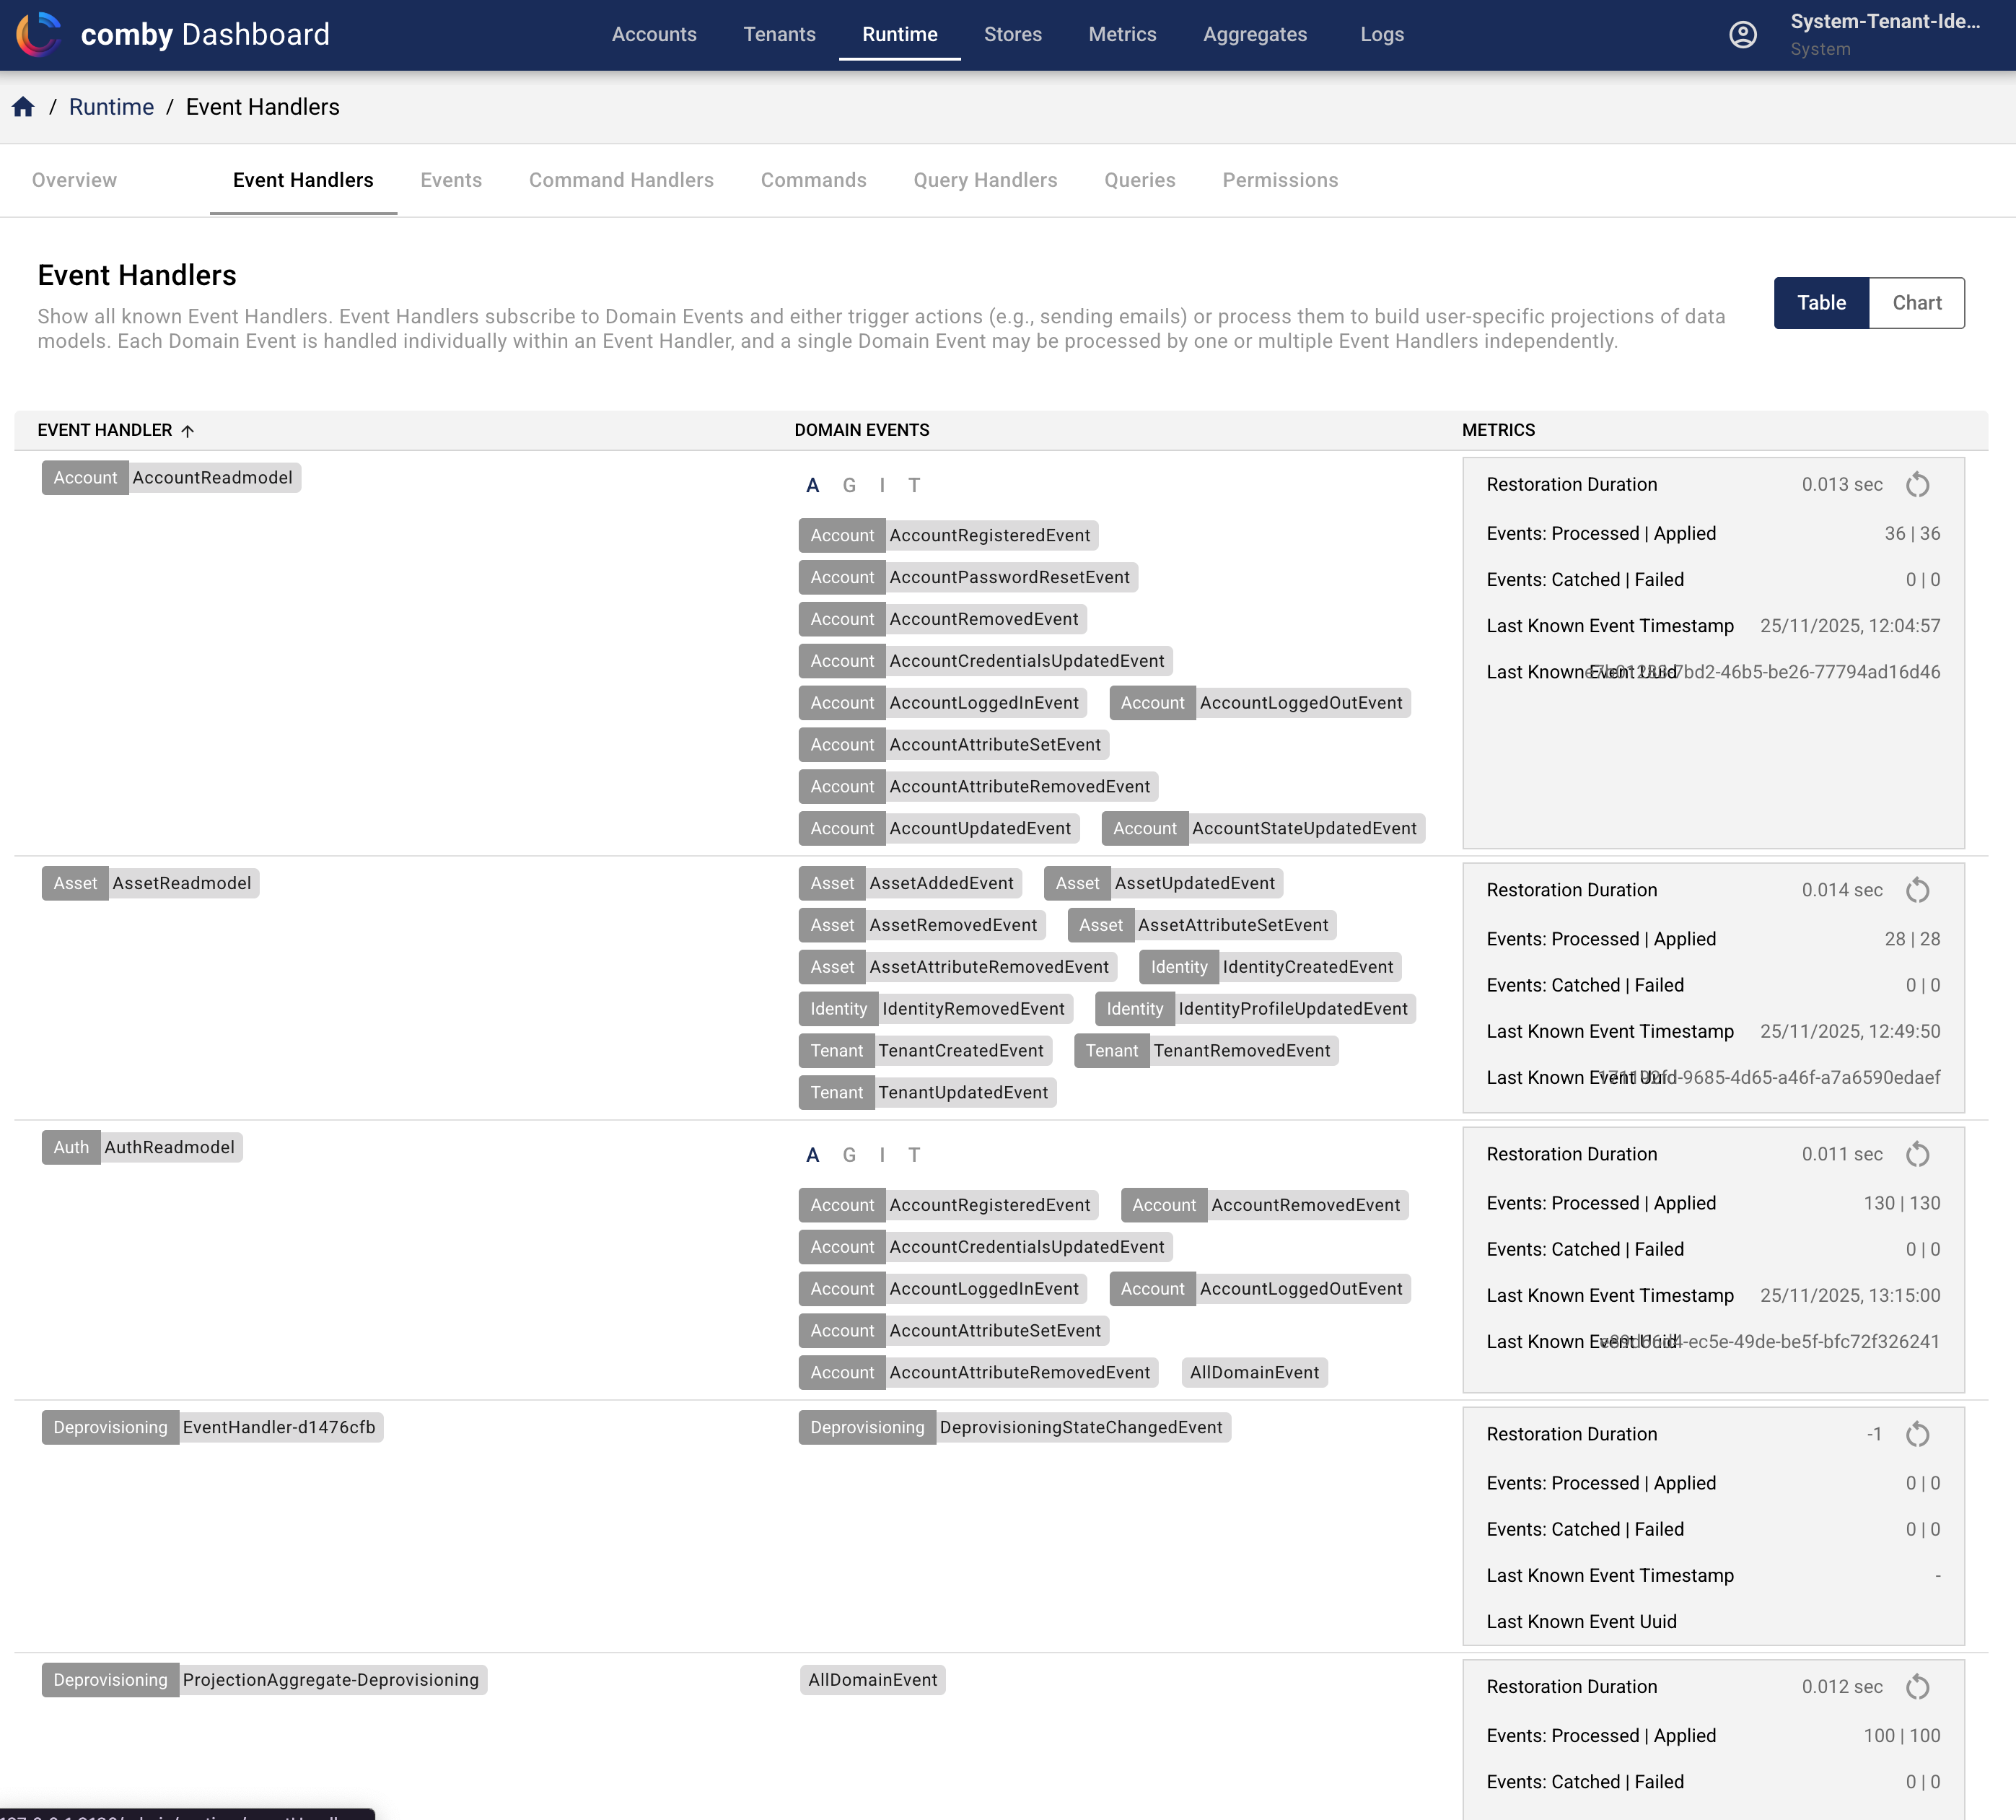
Event-Handlers are responsible for processing events within the system. They listen for specific events and trigger appropriate actions in response. The Admin Dashboard provides a way to manage these event-handlers, including configuring their behavior and monitoring their performance.
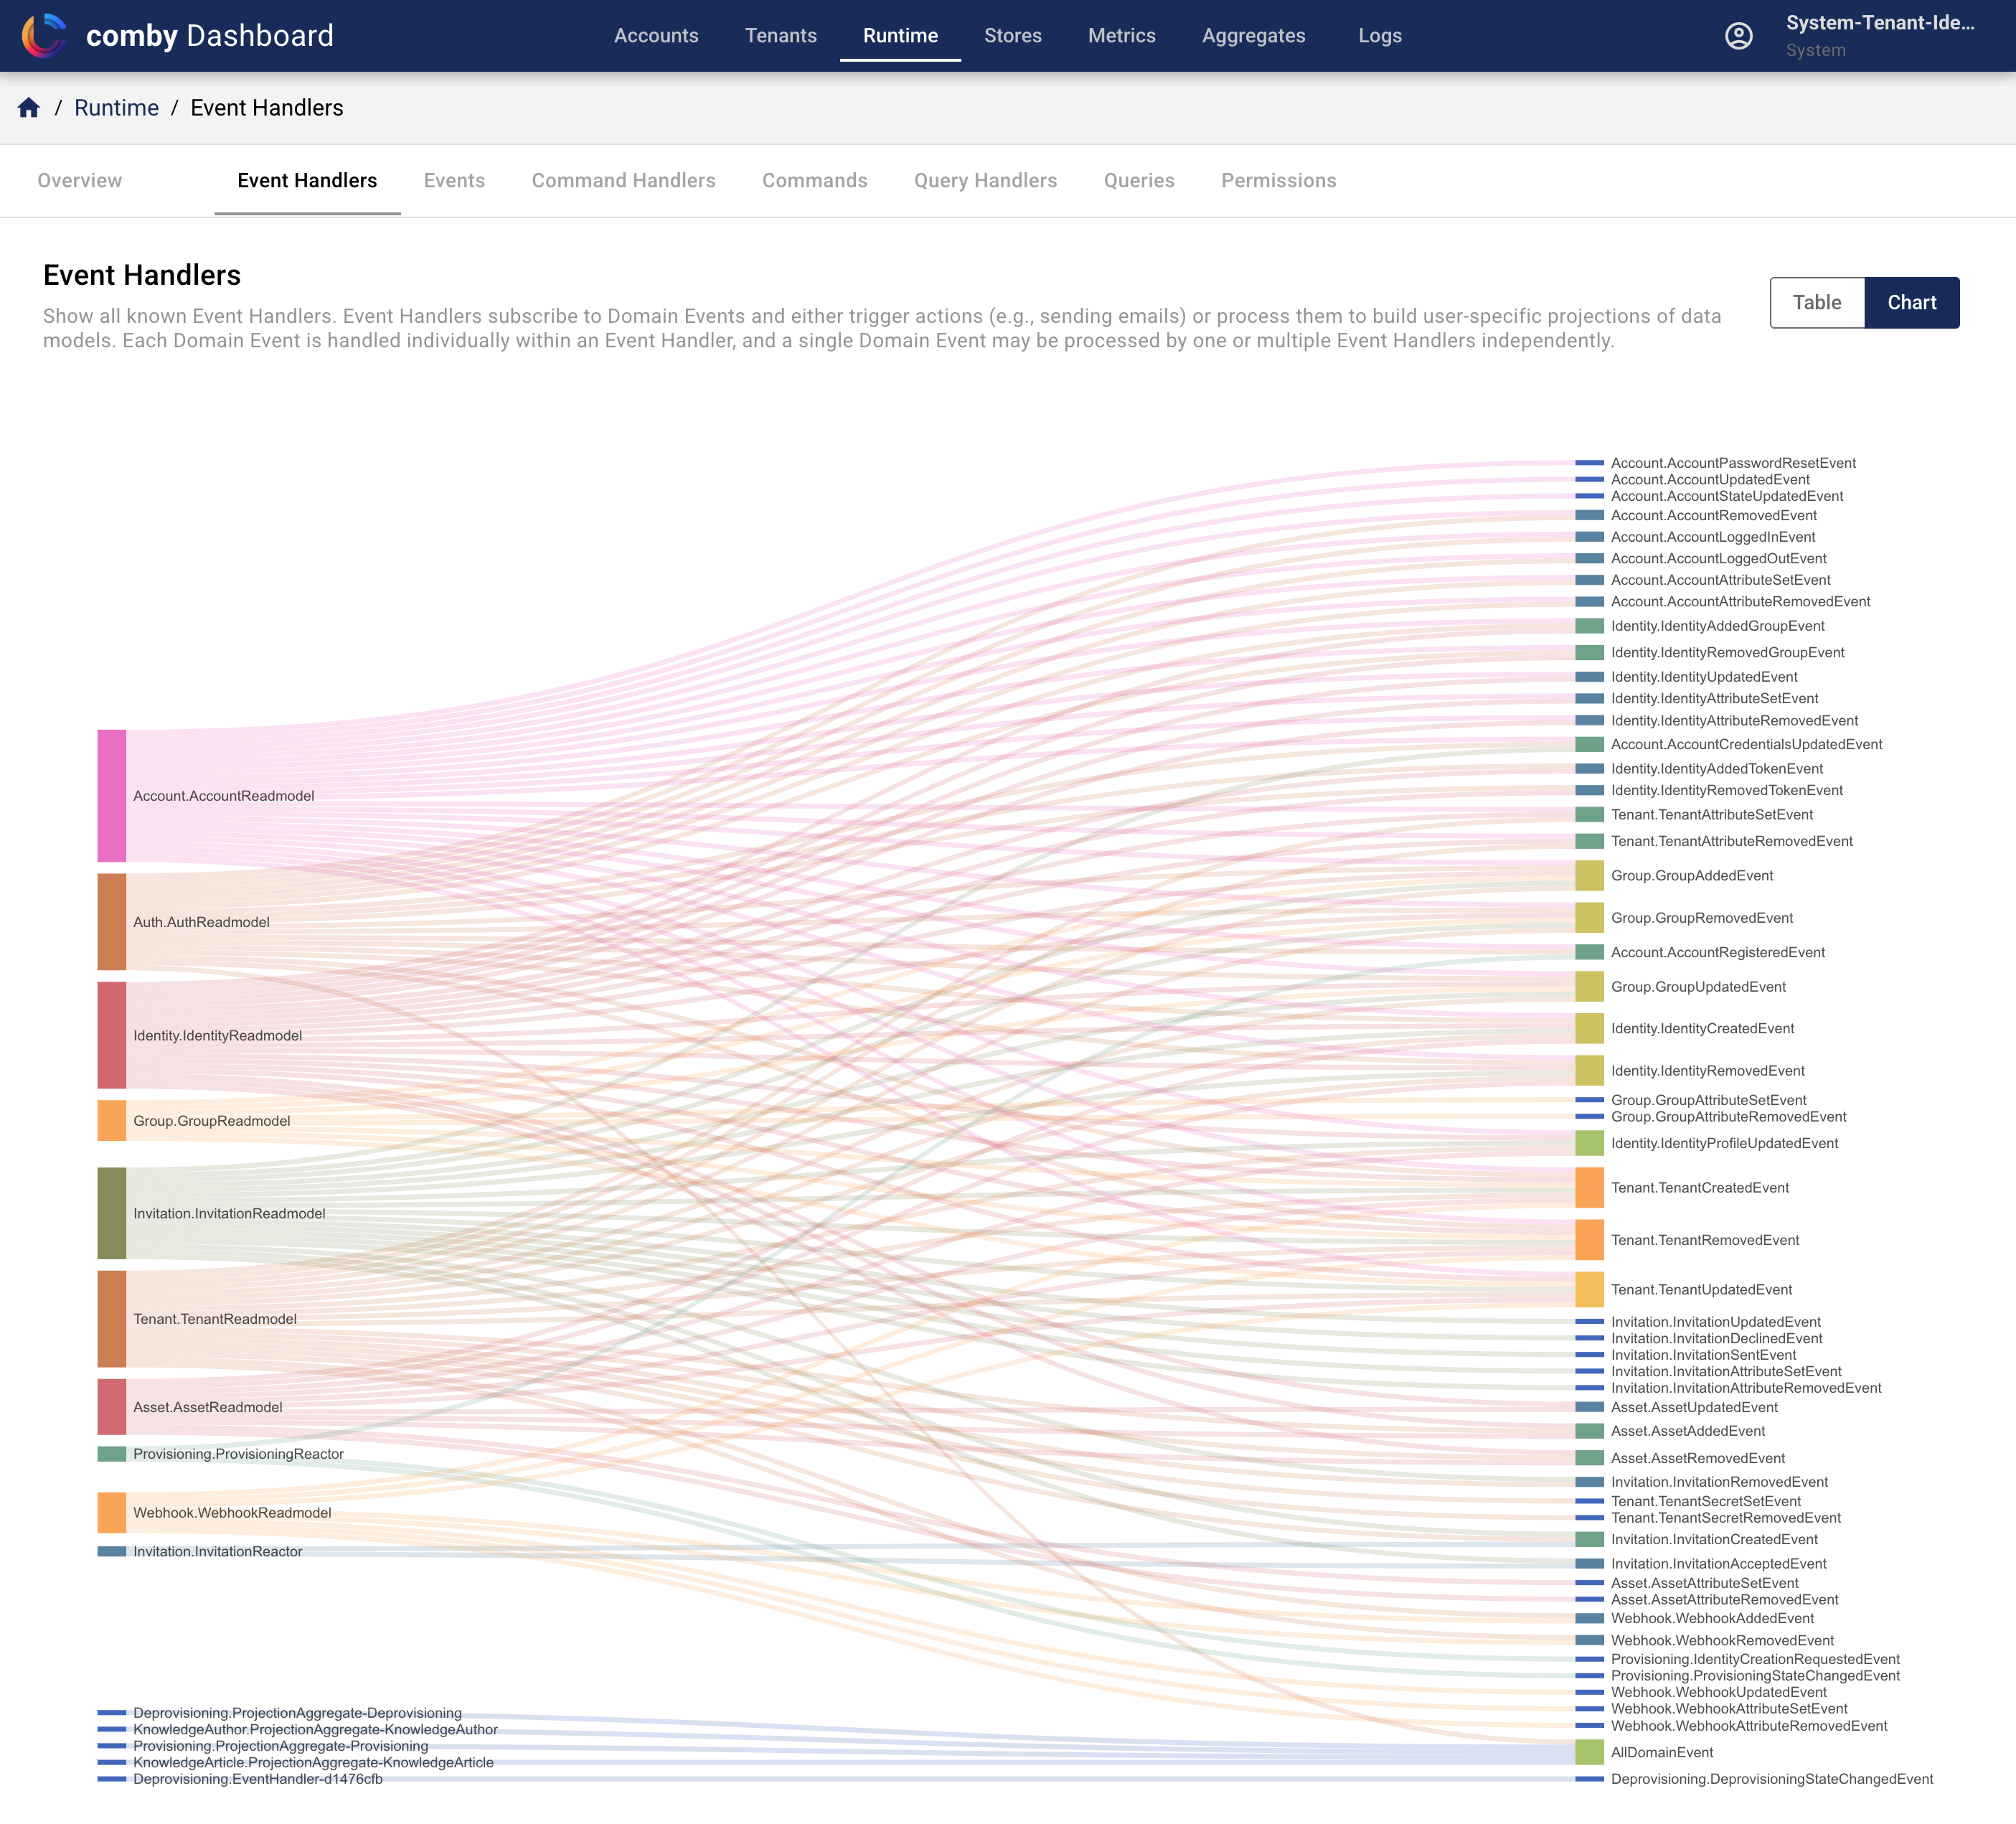
The table can also be drawn as a graph, then you can see which event handler listens for which event:
Event Store View
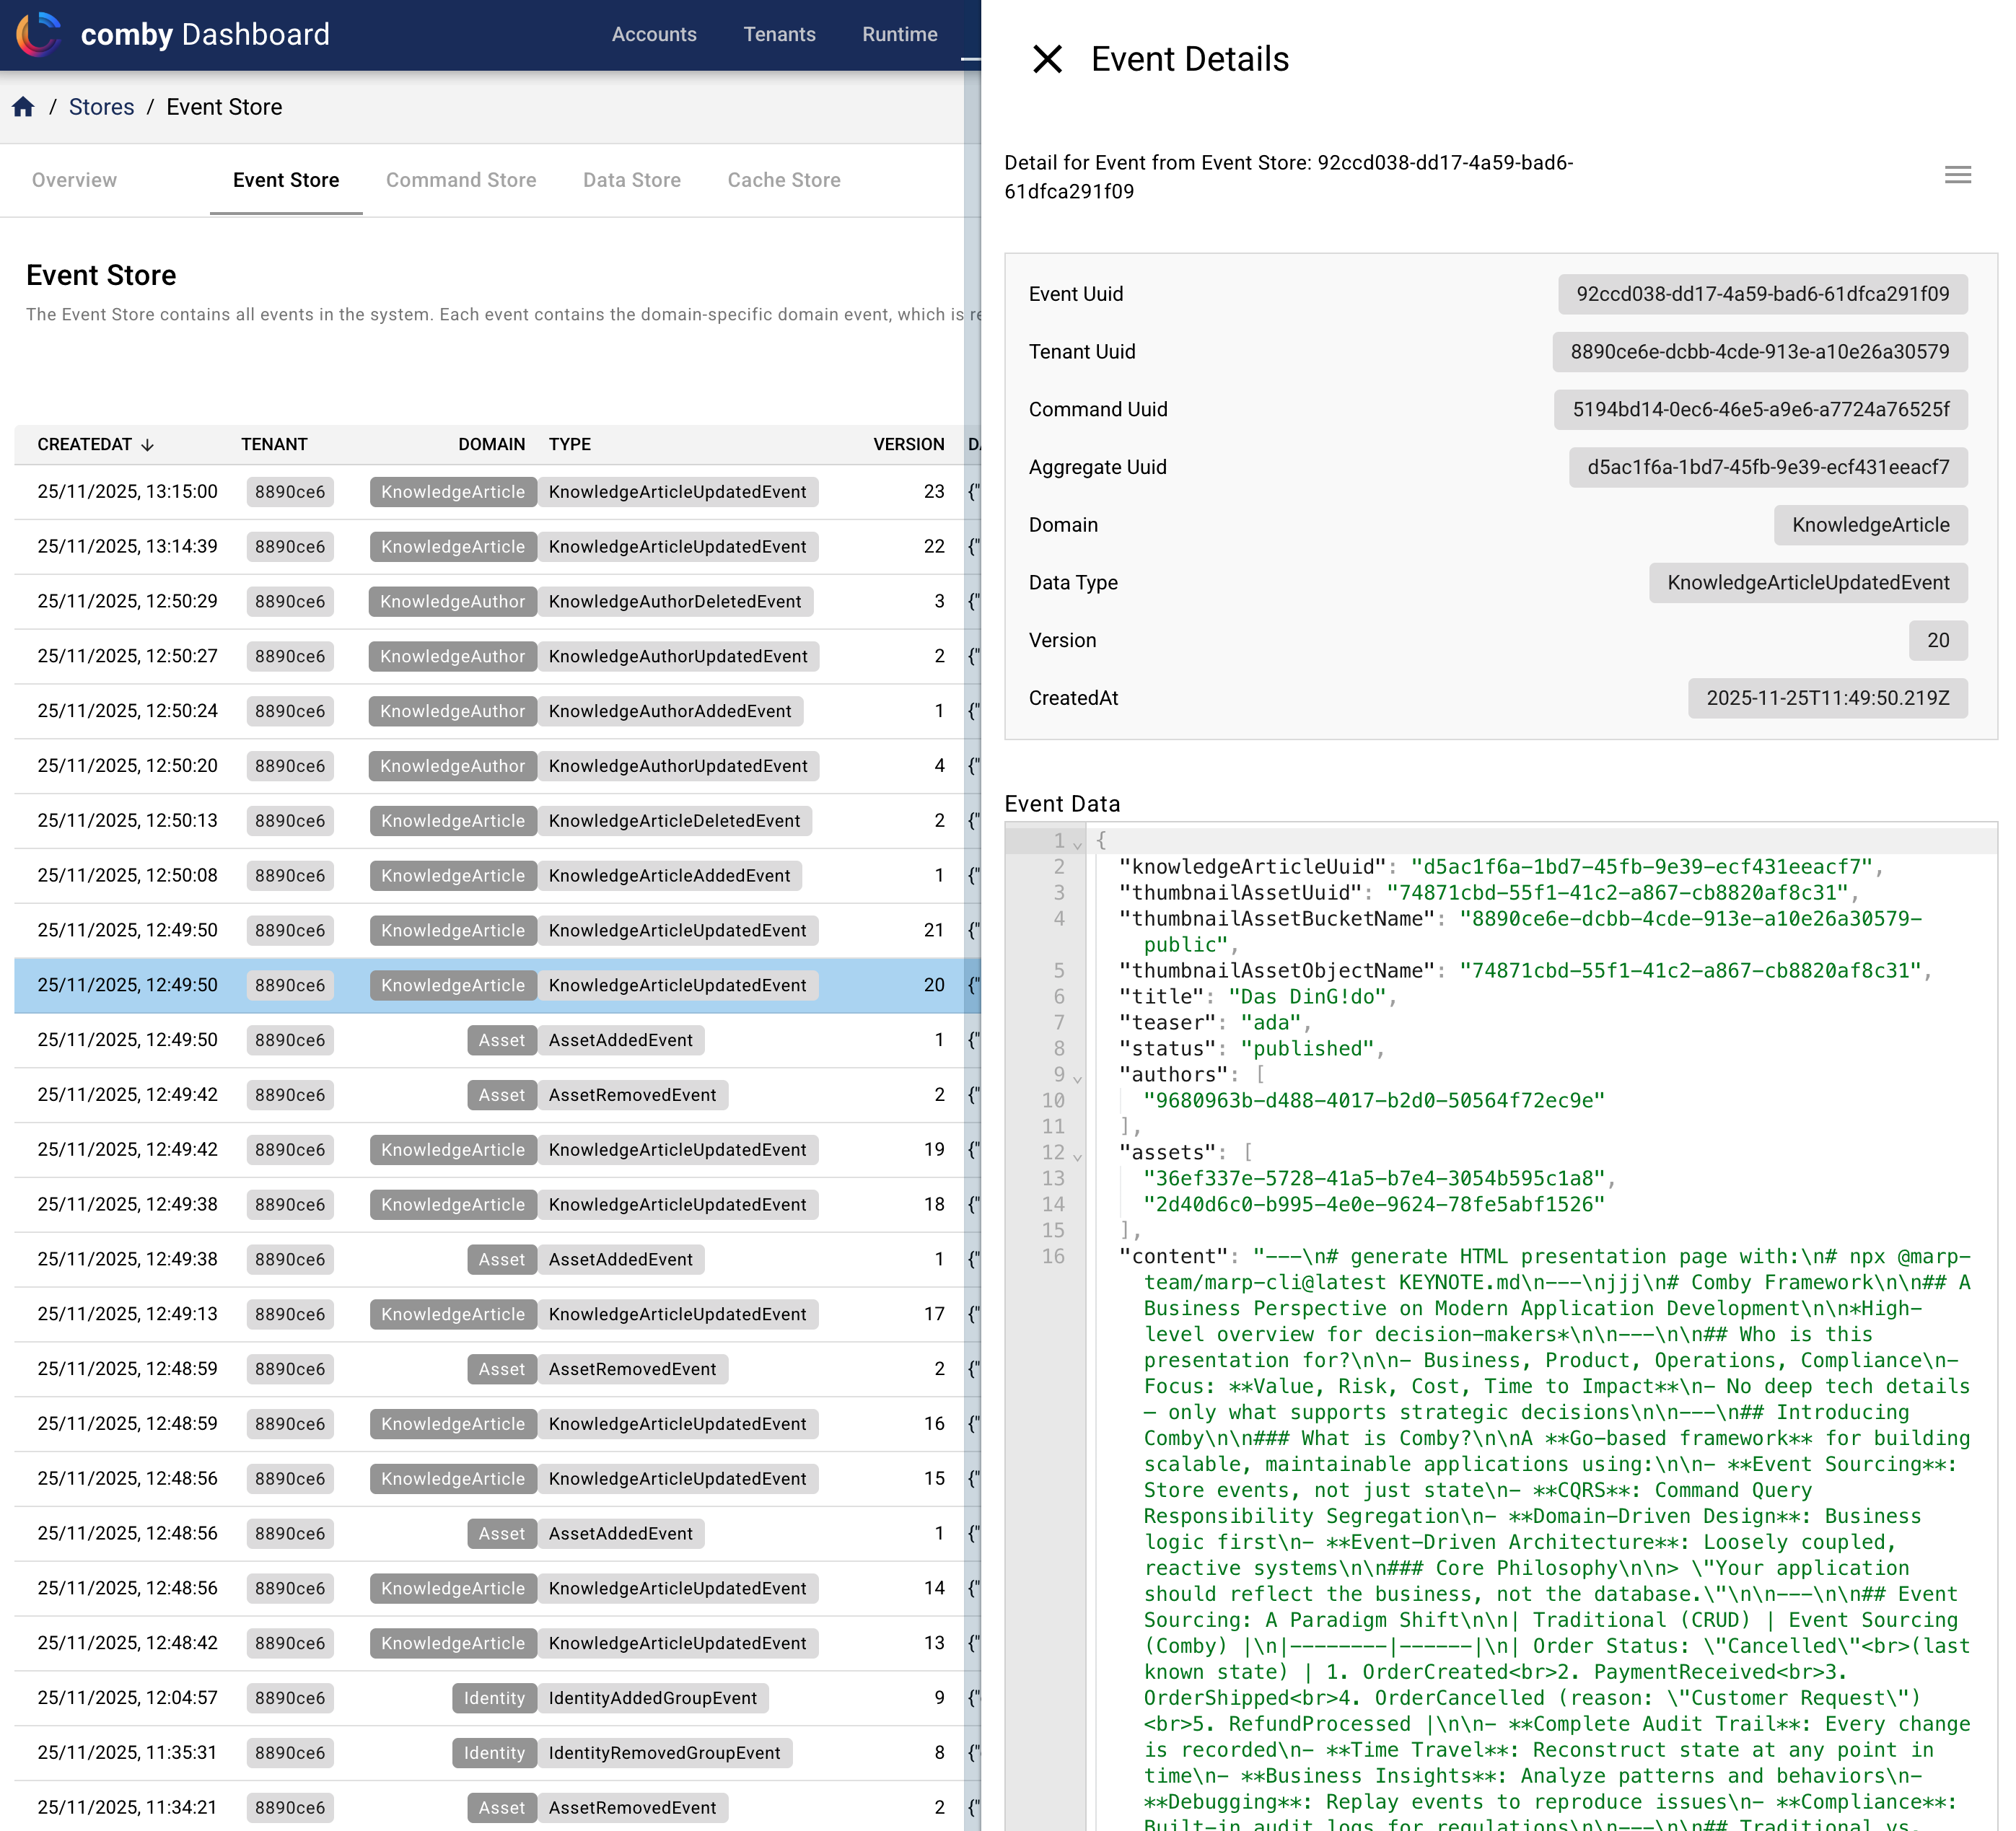
Event Stores are responsible for persisting events within the system. They provide a reliable way to store and retrieve events, ensuring that no events are lost and that the system can be restored to a consistent state in the event of a failure. The Admin Dashboard provides a way to manage these event stores, including configuring their behavior and monitoring their performance.
Metrics View
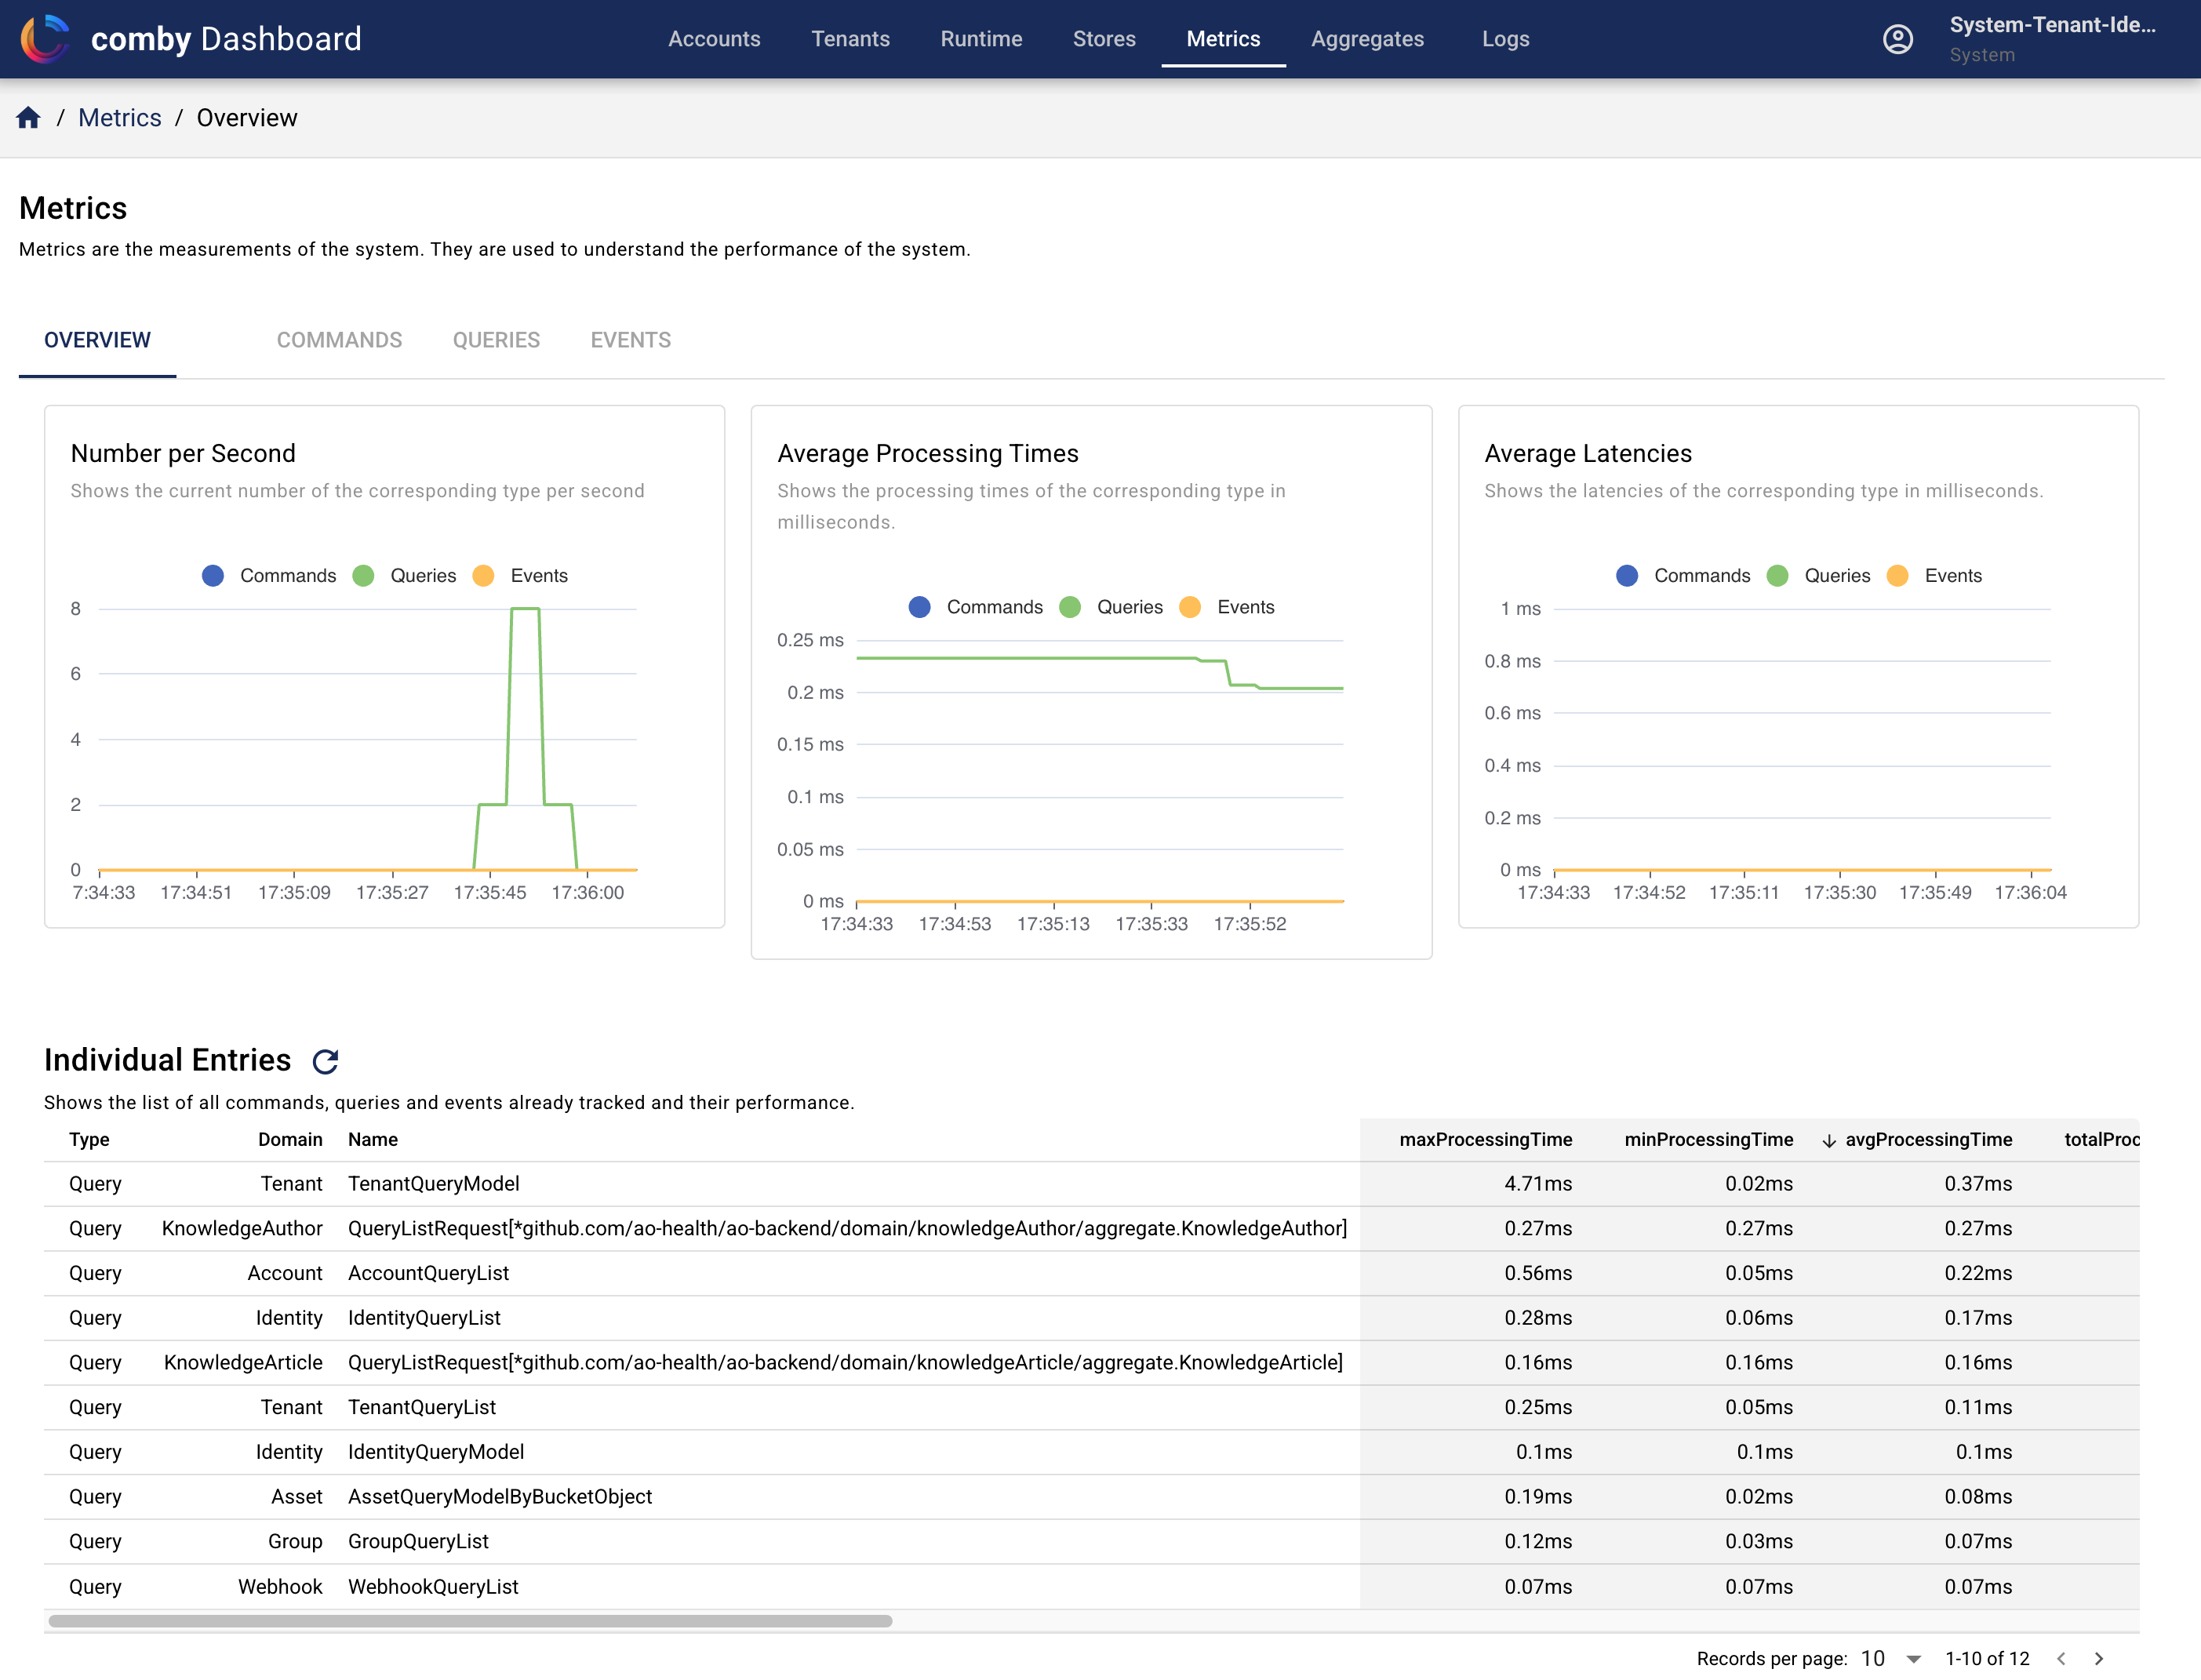
Metrics provide insights into the performance and usage of the system. The Admin Dashboard includes various tools for monitoring key metrics, such as response times, error rates, and user activity. By analyzing these metrics, you can identify potential issues and optimize the system for better performance.
Logs View
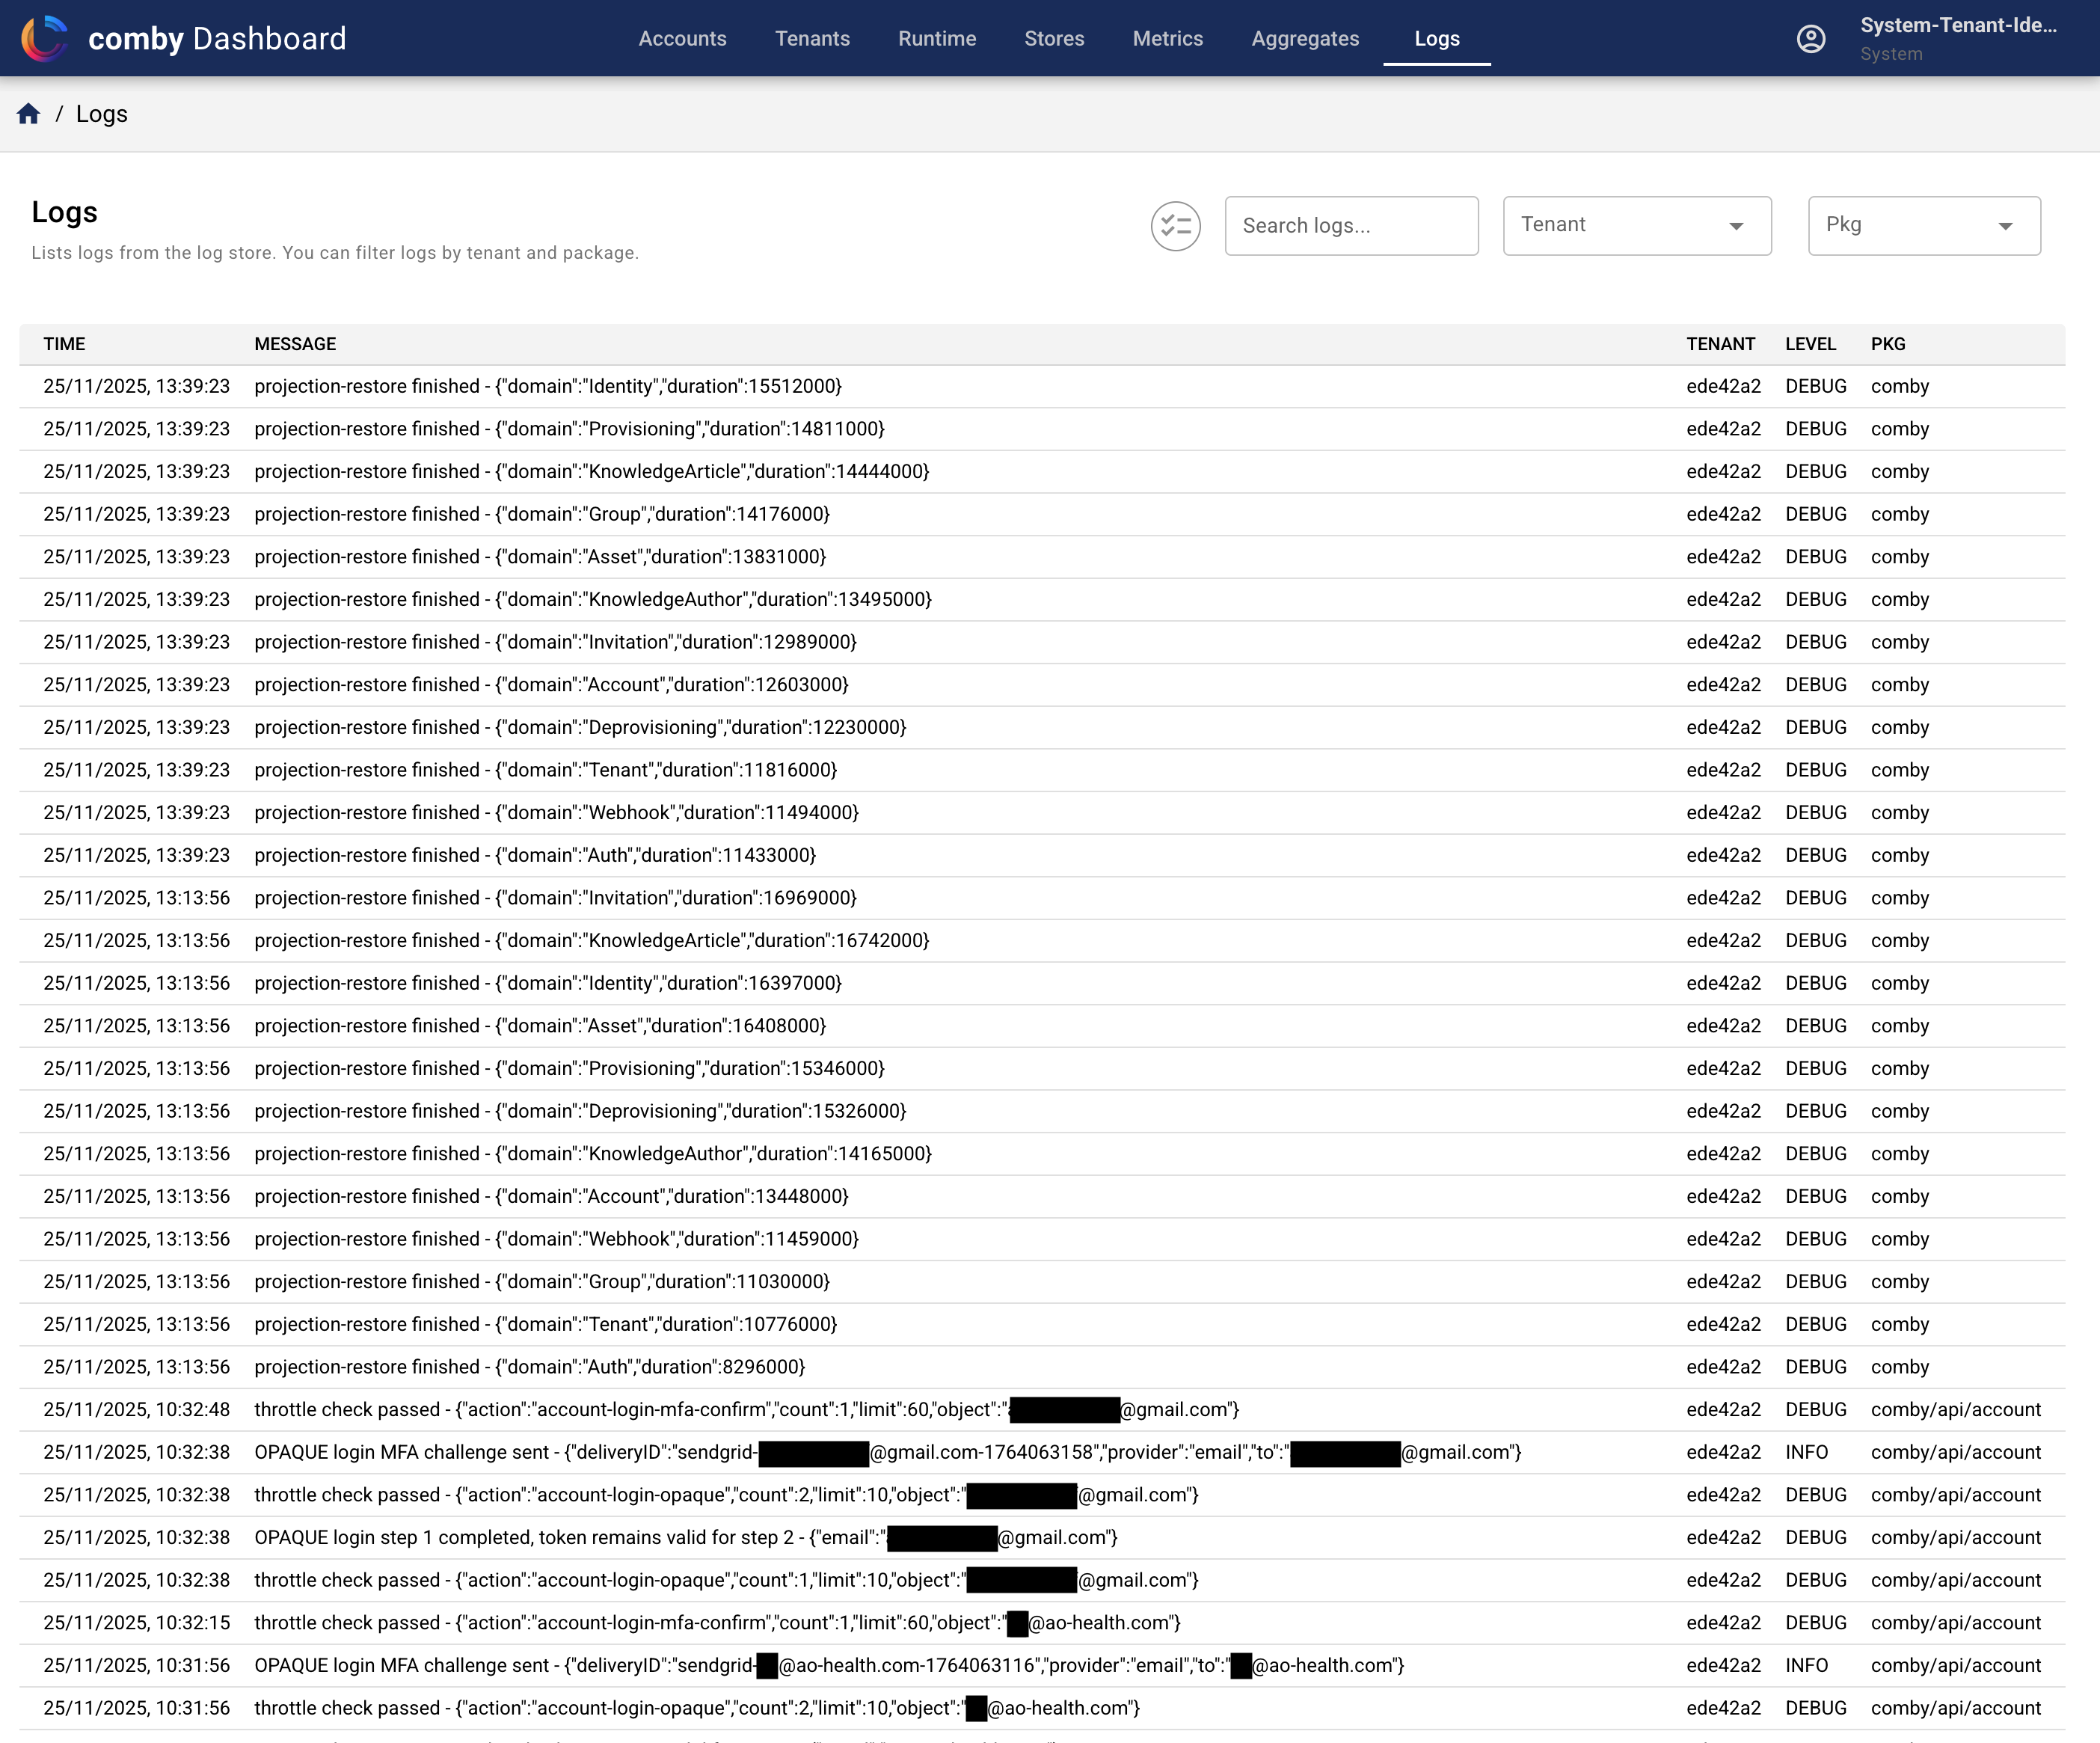
Logs provide a detailed record of system activity, including errors, warnings, and informational messages. The Admin Dashboard includes a log viewer that allows you to search, filter, and analyze log entries. By reviewing logs, you can troubleshoot issues and gain insights into system behavior.